
Figure 2.
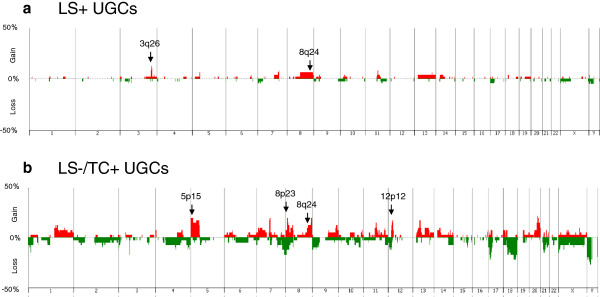
Frequency of copy-number alterations at the chromosome level. The percentage of the samples that have CNAs for each chromosome in the LS+ UGCs (a) and LS−/TC+ UGCs (b). Gains and losses are indicated with red and green, respectively.
Official websites use .gov
A
.gov website belongs to an official
government organization in the United States.
Secure .gov websites use HTTPS
A lock (
) or https:// means you've safely
connected to the .gov website. Share sensitive
information only on official, secure websites.
Frequency of copy-number alterations at the chromosome level. The percentage of the samples that have CNAs for each chromosome in the LS+ UGCs (a) and LS−/TC+ UGCs (b). Gains and losses are indicated with red and green, respectively.