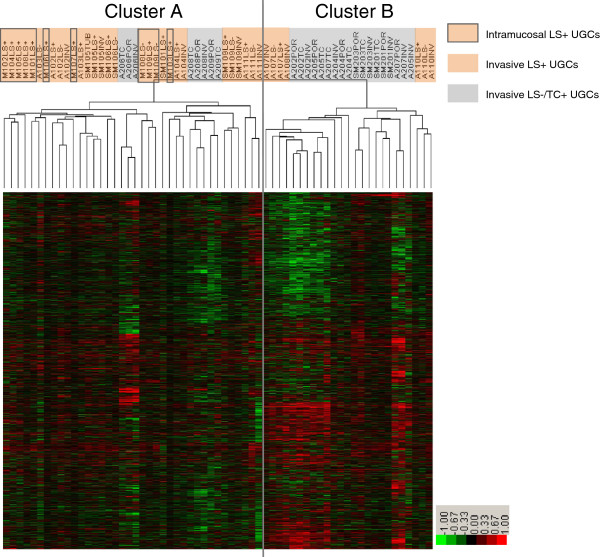
Figure 3.
Unsupervised hierarchical cluster analysis of array-based comparative genomic hybridization (aCGH) data. Gene copy-number gains and losses are indicated by red and green, respectively. A total of 63 samples from 29 UGCs were classified into two major clusters: A and B. Most samples of LS+ UGCs were included in cluster A and most LS−/TC+ UGCs samples were in cluster B. All the Intramucosal LS+ UGCs were included in cluster A.

