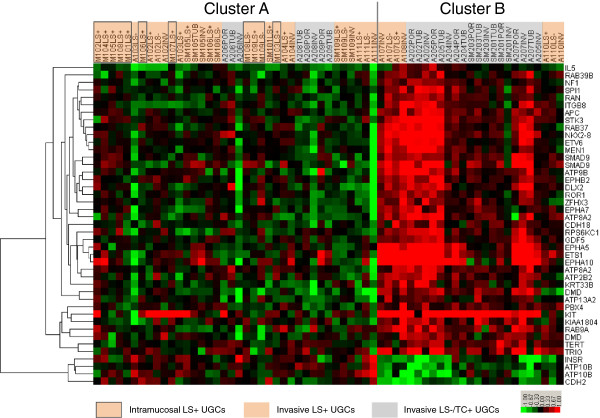
Figure 5.
Array CGH data of genes other than MYC and TP53 with significantly different T/R ratio between clusters A and B. UGCs are divided into clusters A and B that were determined in Figure 3. The heat map indicates the base 2 logarithm of the test/reference signal intensity ratios of array CGH data. Gains and losses are indicated with red and green, respectively.

