
Figure 6.
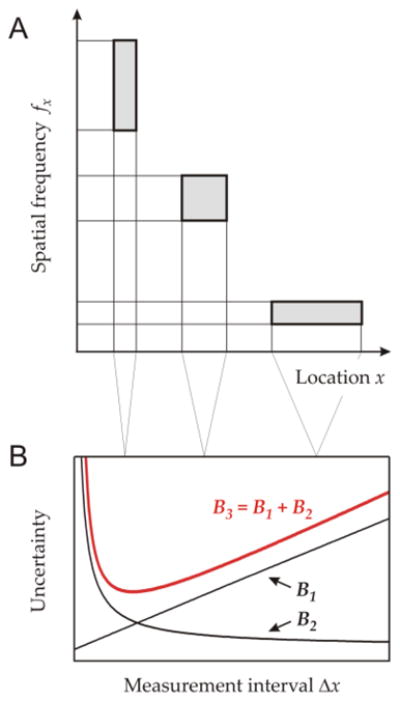
(A) Information cells and uncertainty tradeoff. The three rectangles are the information cells. Their projections on dimensions x and fx represent, respectively, the precision of measuring signal location and content: the larger the projection, the lower the precision (higher uncertainty) of measurement. The cells have the same area (product of intervals on x and fx) but their shapes vary. (B) Uncertainty functions in one dimension. Curves B1 and B2 are the uncertainty functions associated with measuring signal location and content, by a sensor of size Ax. The values of B1 and B2 are proportional to, respectively, the horizontal and vertical extents of the information cells in panel A. B3 is a joint-uncertainty function. It represents the uncertainty of simultaneous measurement of stimulus location and content. Low values of B3 at intermediate magnitudes of Ax indicate that sensors of intermediate size are most suitable for jointly measuring signal location and content.