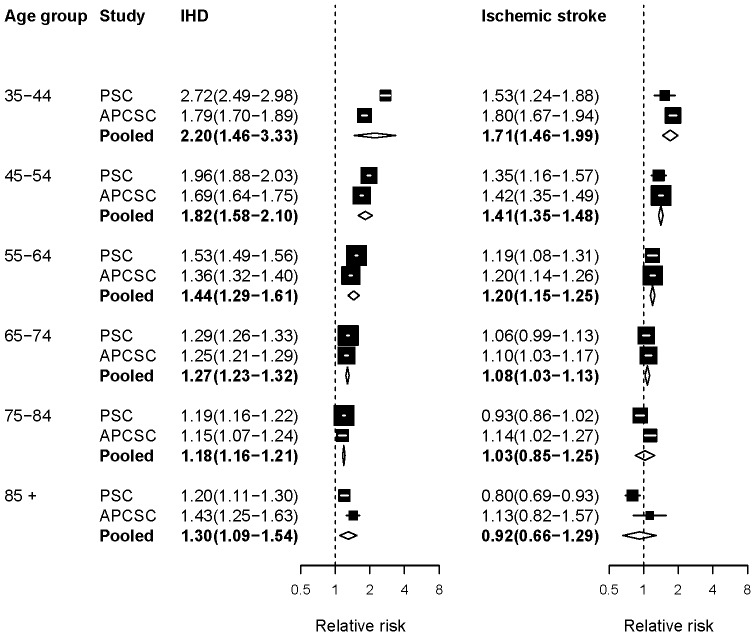
Figure 2. Relative risks (RRs) for diseases associated with serum total cholesterol (TC).
The figure shows RRs for 1 mmol/L higher usual TC. The figure shows RRs converted to comparable age group as described in Methods. See Table S1 for RRs in original age groups from each study. The percentage of variation in the pooled estimates that is due to statistical heterogeneity was evaluated using the I2 statistic for each age group and outcome. Of all the outcomes and age groups analyzed, only ages 35–44 years in the pooled analysis for IHD had a non-zero I2 value of 58.8%.

