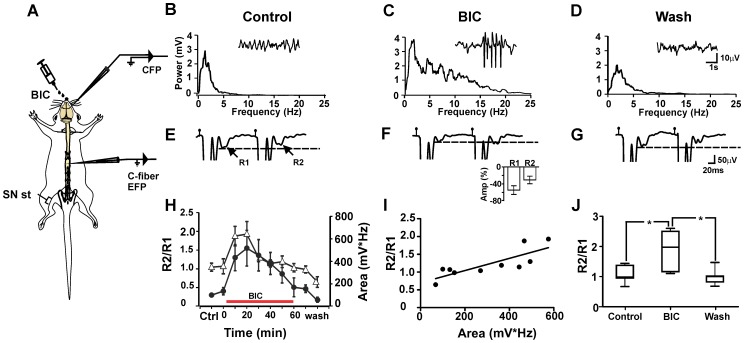
Figure 3. Sensorimotor cortex modulates the PPR of C–fiber EFPs.
A, Schematic diagram of the experimental arrangement. B, Power spectrum of the spontaneous cortical activity recorded for 30 sec. The insert shows a sample of spontaneous field potential recorded in the sensorimotor cortex (1000 µm depth, 2.5 mm caudal to bregma, and 3 mm from the midline). C, the same but after 20 min of BIC topical administration (100 µL, 100 µM) on the surface of the sensorimotor cortex. D, the same but after wash. E–G, representative electrophysiological recordings (arrows) of C–fiber evoked responses (R1 and R2) produced by a pair of consecutive stimuli in the SN in control conditions (E), after BIC administration (F), and during wash (G). The insert shows the percent inhibition of the C–fiber EFPs R1 and R2 after 20 min of BIC administration onto the cortex. H, Changes in the PPR (R2/R1) (triangles), and the area below the curve computed from the power spectra of cortical activity during BIC administration (circles). I, graph showing a significant positive correlation between the PPR and the area below the curve computed from the cortical activity power spectra (r = 0.86). J, box plot of the PPR computed in 7 experiments in control conditions, after 20 min of BIC administration, and during wash. *p<0.05, Kruskall–Wallis ANOVA.

