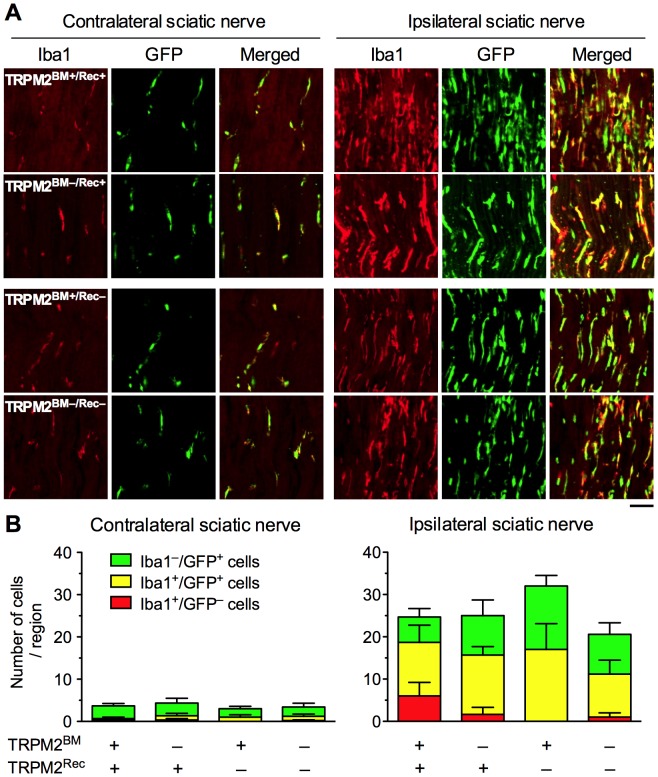
Figure 3. Infiltration of GFP+ BM-derived cells around the injured sciatic nerve in WT/TRPM2-KO BM chimeric mice.
(A) GFP+ cells and Iba1+ cells were visualized by GFP fluorescence (green) and immunostaining with Iba1 antibody (red), respectively, in the sciatic nerve sections around the ligation site 14 days after pSNL surgery. Iba1+/GFP+ cells were visualized as a yellow signal in merged images. Representative microphotographs are shown (scale bars = 50 µm). (B) The numbers of Iba1−/GFP+ cells, Iba1+/GFP−cells, and Iba1+/GFP+ cells within the images were counted in the contralateral (left panel) and ipsilateral (right panel) sections. n = 3–5. Data are expressed as the mean ± SEM.

