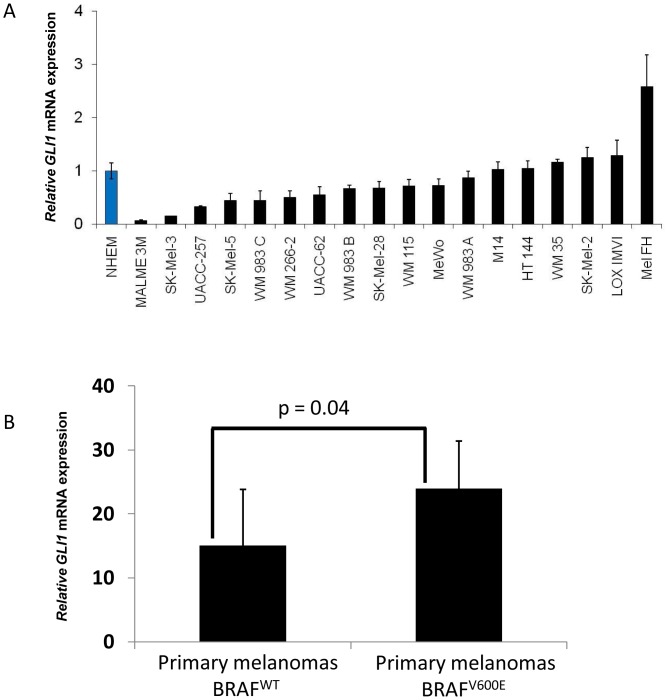
Figure 1. Evaluation of the GLI1 expression in human melanoma cell lines and human primary melanoma tissues.
A) Relative GLI1 RNA expression in human melanoma cell lines and normal human melanocytes as measured by quantitative RT-PCR. B) GLI1 RNA expression in human primary melanoma tissues harboring wild type (n = 7) or V600E activating mutation in BRAF (n = 15) evaluated by Affymetrix gene profiling. P<0.05 is considered significant. Mean values with SD are shown. ANOVA test with Tukey's post-test.

