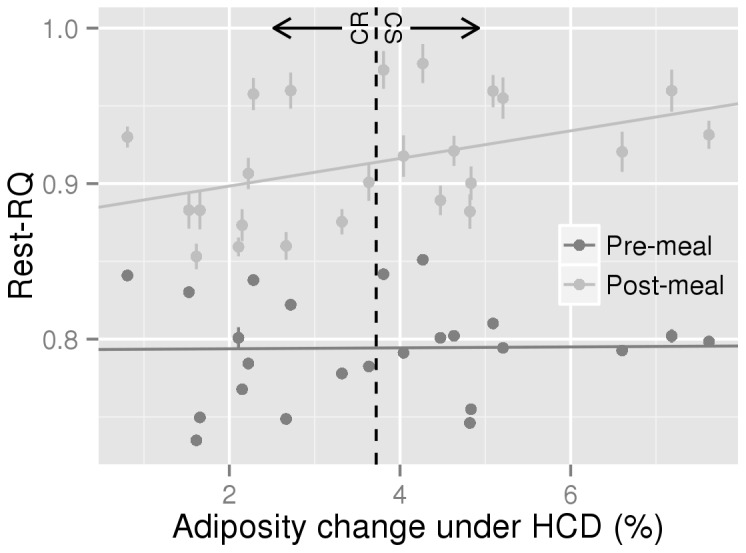
Figure 3. Analysis of the relationship between HCD adiposity gain and Rest-RQ response to a HC meal.

Dark grey points (one for each rat) represent mean pre-meal baseline data (-120 to 0 mins), and light grey points (again, one for each rat) the mean post-meal response (0 to 300 mins). The vertical lines on each point represent the individual rat’s SEM. For interest, a broken vertical line is presented separating the CR half of the rats from CS. The pre-meal slope (the fixed effect referred to as “adchg” in the Materials and Methods, describing how pre-meal Rest-RQ is related to adiposity change) is not significantly different from zero (0.0003±0.0041, P=0.943). The post-meal slope (the fixed effect referred to as “interaction”, describing how post-meal Rest-RQ response is differently related to adiposity change when compared to the pre-meal slope) is significant (0.0086±0.0026, P=0.003) indicating that the higher the post-meal RQ increase, the higher the sensitivity to HCD.
