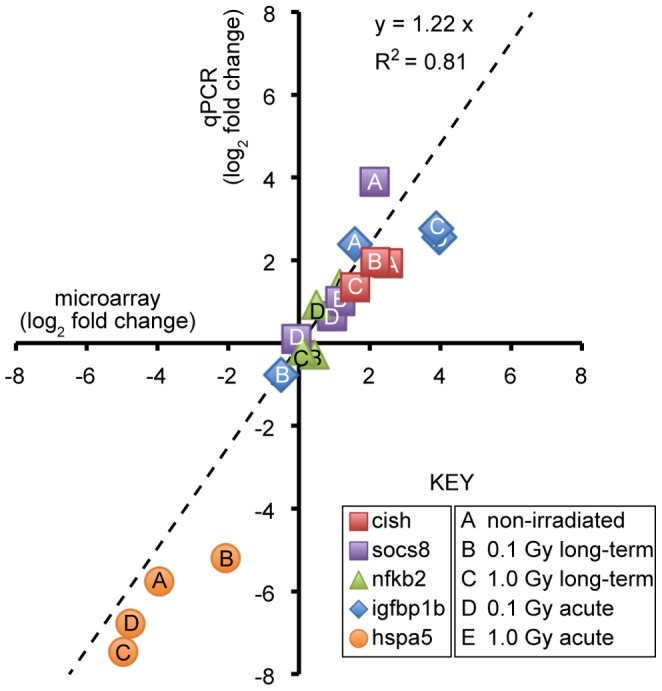
Figure 3. Validation of microarray data by quantitative polymerase chain reaction.

Scatter plot shows fold change on logarithmic scale as measured for selected genes by microarray and qPCR. Each point represents mean value for one gene and experimental group. Shape and color denotes gene; letter indicates experimental group as indicated.
