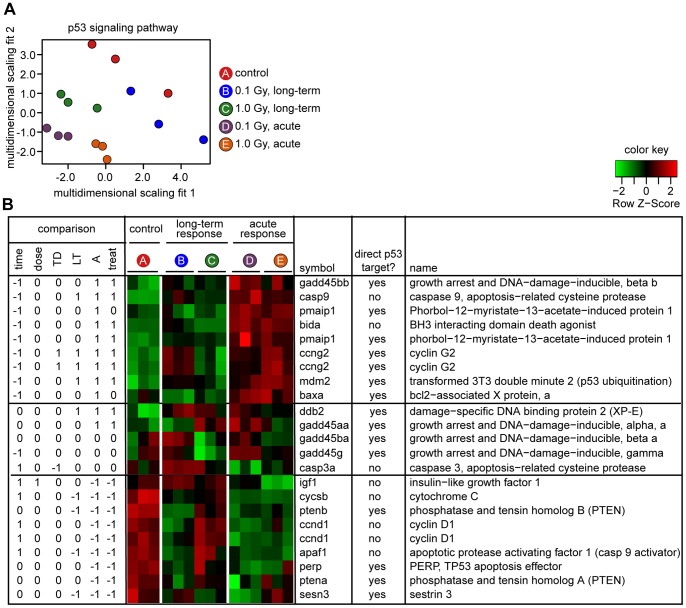
Figure 4. Analysis of p53 signaling pathway.
A. Multidimensional scaling representation of results for the p53-signaling pathway, based on 36 probe sets for which data are available. Each symbol represents one biological replicate. Color denotes treatment group as indicated. B. Response for 23 probe sets that showed statistically significant differences in one or more comparisons. (Results of comparisons are expressed as “1”, “0” or “−1” using the same convention as in Figure 2). One gene (gadd45ba) was included because it was significant in an overall F test, although not in any of the individual comparisons. Left, results of statistical comparisons, notation as in Figures 1 and 2. Center, heat map, as in Figure 2. When more than one row has the same gene symbol, it indicates different probe sets directed against the same mRNA. Right, gene symbols, whether gene is a direct target of the p53 transcription factor, and gene name. In some cases, an alternative name or description of gene function is given in parentheses. For details of KEGG p53 signaling pathway – Danio rerio (zebrafish): http://www.genome.jp/kegg-bin/show_pathway?dre04115.

