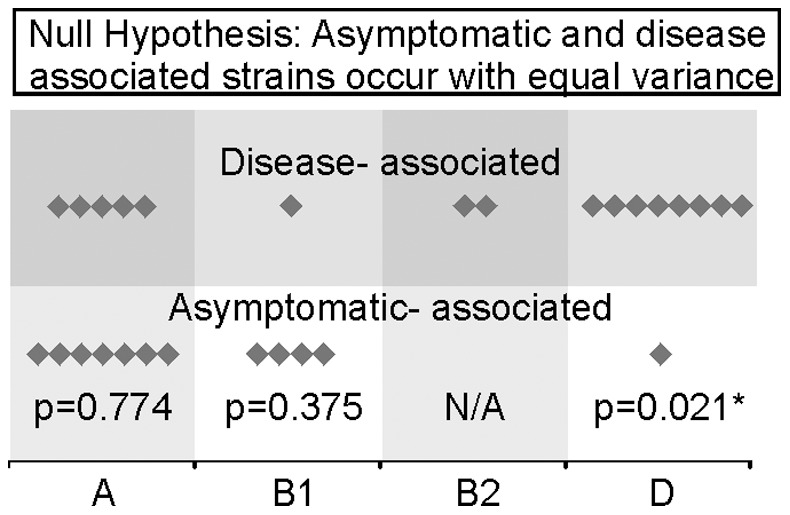
Figure 1. Distribution of asymptomatic and disease-associated EAEC strains across the four ECOR phylogroups.

Strains from phylogroup A (12 strains) and B1 (5 strains) are equally distributed between the two groups. EAEC strains for phylogroup D (9 strains) are not equally distributed being highly associated with cases. There were not enough strains from phylogroup B2 (2 strains) for statistical analysis.
