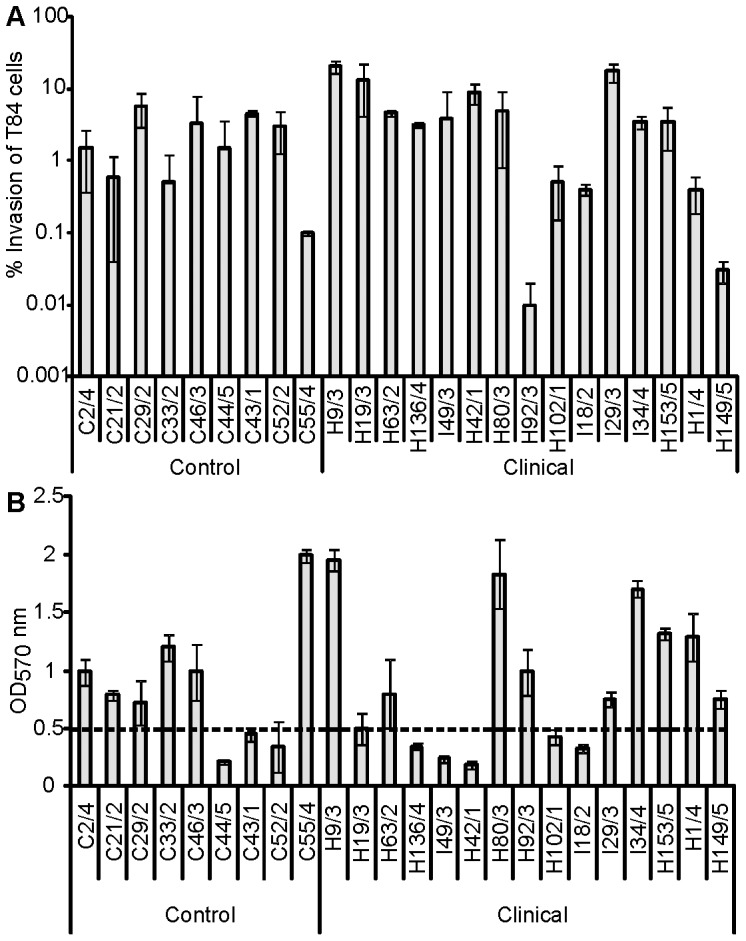
Figure 2. Phenotypic characterisation of EAEC strains.

(A) Invasion levels showed by EAEC clinical and control strains after 3 h co-incubation with T84 cultured cells. No statistically significant difference between case or control strains was detected for the invasion assays. (B) Biofilm production on polystyrene determined semi-quantitatively according to OD570 values of strains screened for biofilm production. High biofilm production was defined when OD570 was higher/equal than 0.5.
