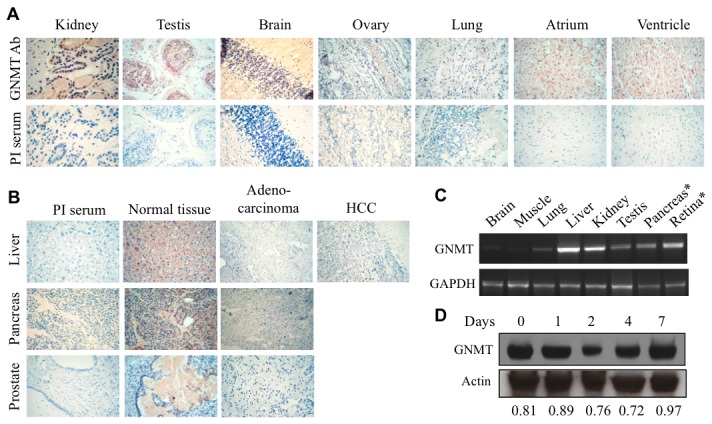
Figure 2. Presence of GNMT in human tissues.

A. Immunohistochemical staining of normal human tissues with GNMT-specific antibody or preimmune (PI) serum (control). B. Immunohistochemical staining of GNMT in normal tissues compared to malignant tumors of the same origin. C. Levels of GNMT mRNA in rat tissues; for pancreas, ten-fold less cDNA was used for PCR compared to other tissue; for retina, ten-fold more cDNA was used (in all cases the same amount of cDNA was used for GAPDH amplification). D. Levels of GNMT in normal and regenerating rat liver (Western blot of samples obtained 1-7 days after 70% hepatectomy; control sample represents levels of GNMT in resting liver. Numbers indicate ratio of the intensity of GNMT and actin bands.
