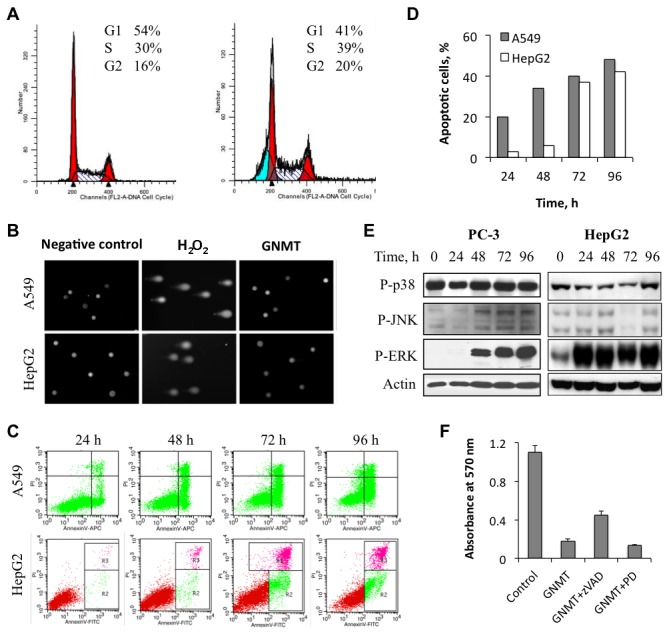
Figure 4. Cellular responses to GNMT expression.

A. Distribution of GNMT-expressing cells (right panel) between cell cycle phases (propidium iodide staining) compared to control (left panel) GNMT-deficient cells. B. Assessment of DNA damage in GNMT expressing cells by the Comet assay. C. Apoptotic cells assessed by Annexin V/propidium iodide staining after GNMT expression (bottom right quadrant, early apoptotic cells; upper right quadrant, late apoptotic cells); only green cells (expressing GFP-GNMT) were evaluated. D. Calculation of apoptotic cells from C. E. Activation of ERK phosphorylation in response to GNMT expression. F. zVAD-fmk, but not ERK inhibitor PD98059, partially rescues cells from the antiproliferative effect of GNMT (data for A549 cells are shown).
