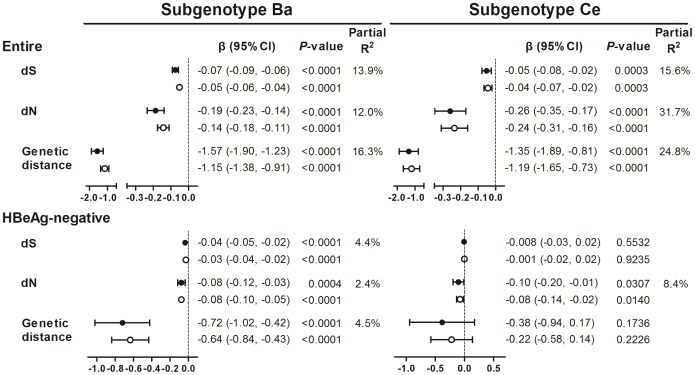
Figure 2. Influence of viral genetic diversity on hepatitis B viral load by HBV subgenotypes.
The plot show the estimated impact (β estimates; regression coefficients) per 1-unit increment of dS (10−3 substitution per site), dN (10−3 substitution per site), or genetic distance (10−2 nucleotide substitution) on cross-sectional (solid circle and horizontal line) and longitudinal (empty circle and horizontal line) measures of viral load (log copies/mL) and 95% confidence intervals (CIs). All regression models include age as a covariate. The partial R2 values measure the marginal contribution of each parameter of viral genetic diversity to the variability in baseline viral load when age was already in the respective linear regression model.

