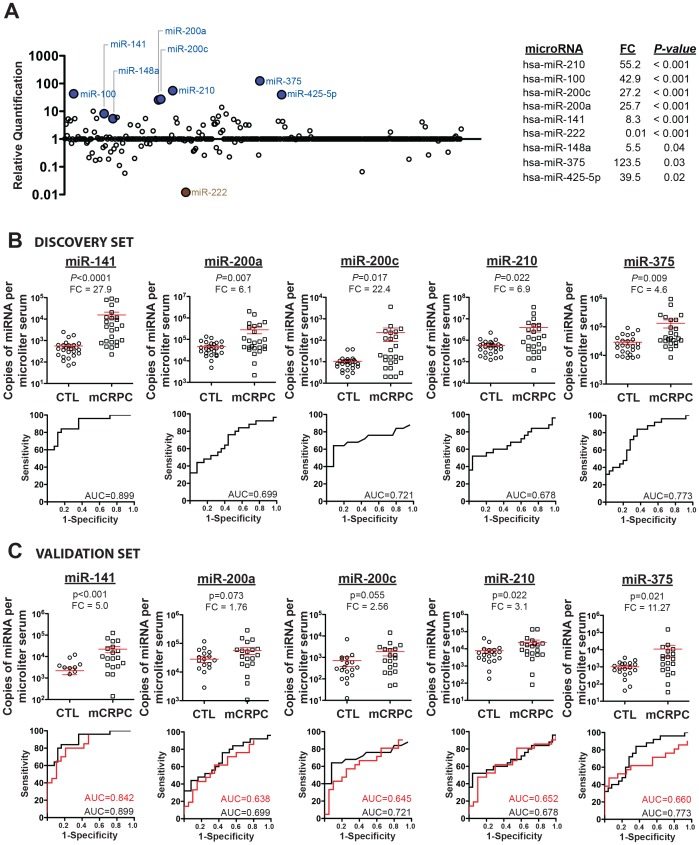
Figure 1. Serum miRNA profiling and validation.
(A) Measurement of circulating miRNAs in sera pooled from patients with advanced prostate cancer as compared to healthy donors (comprising a Discovery Set) by TLDA profiling. Blue- and brown-filled circles represent serum miRNAs increased or decreased (with unadjusted p-value <0.05), respectively, in mCRPC patients compared to healthy controls. Inset: Nine miRNAs demonstrated >5-fold change (unadjusted P<0.05, Student’s t-test). FC, fold-change. (B) Confirmation of mCRPC-associated serum miRNAs in individual samples from the Discovery Set from the University of Washington samples. Upper: miRNA biomarker candidates were measured in individual samples by TaqMan miRNA qRT-PCR (P value assigned by Wilcoxon signed-rank test), where miRNA abundance is given in terms of miRNA copies/µl serum. Red bars, mean +/− SEM of miRNA copies/µl serum for each group. Lower: Receiver operating characteristic (ROC) curves plot sensitivity vs. (1 - specificity) to assess the ability of each miRNA biomarker to distinguish cases from controls. (C) Validation of mCRPC-associated serum miRNAs in an independent Validation Set. Upper: Serum concentration (copies/µl) of miR-141, miR-375, miR-200c, miR-200a and miR-210 was measured by TaqMan miRNA qRT-PCR. Dot-plot associated P values were assigned by Wilcoxon signed-rank test. Dot plots and ROC curves were generated as described for Fig. 1. Lower: Red, results from the validation sample set obtained from the University of Michigan. Black, results from the primary sample set obtained from the University of Washington reproduced from Fig. 1 B , lower. AUC, area under the curve; mCRPC, prostate cancer patient sera; FC, fold-change; CTL, control sera (from age-matched male individuals with normal PSA and negative digital rectal exam).

