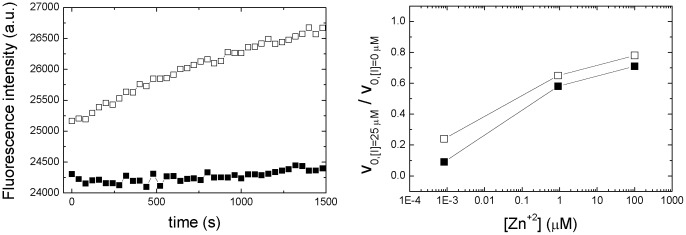
Figure 6. In vitro enzymatic inhibition of NS3 protease.
(Left panel) Fluorescence intensity measured as a function of time (wavelengths of 380 nm and 500 nm for excitation and emission, respectively) for the substrate catalysis by NS3 protease in the absence (open squares) or presence of compound 1 at 25 µM (closed squares), in sodium acetate pH 5, 0.8 nM free Zn+2 concentration. (Right panel) NS3 protease activity was determined as the initial slope of the curves. The percentage of activity is calculated as the quotient between the activity of NS3 protease in the presence (25 µM) and the absence of a given compound (compound 1, closed squares; compound 5, open squares).

