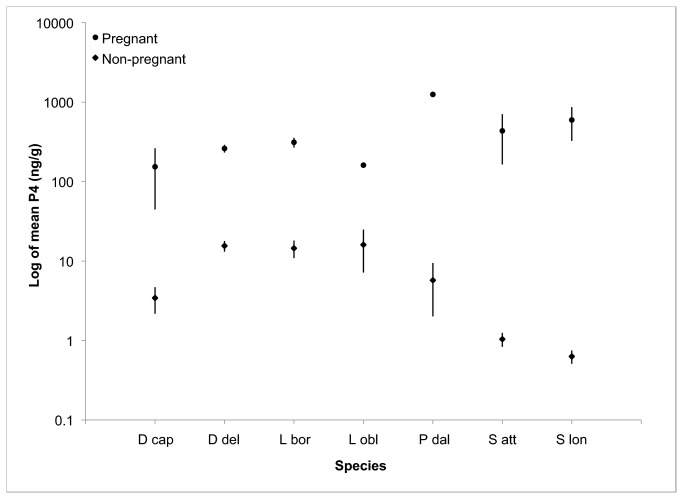
Figure 3. The mean P4 values for this study are combined with those from Kellar et al [13] to illustrate species-specific variability.
Note that the y-axis is presented on a log10 scale to show a wide range of P4 values; whiskers indicate the standard error of the non-log values (D cap – Delphinus capensis , D del - Delphinus delphis , L bor - Lissodelphis borealis , L obl - Lagenorhynchus obliquidens , P dal - Phocoenoides dalli , S att - Stenella attenuata , S lon - Stenella longirostris ).

