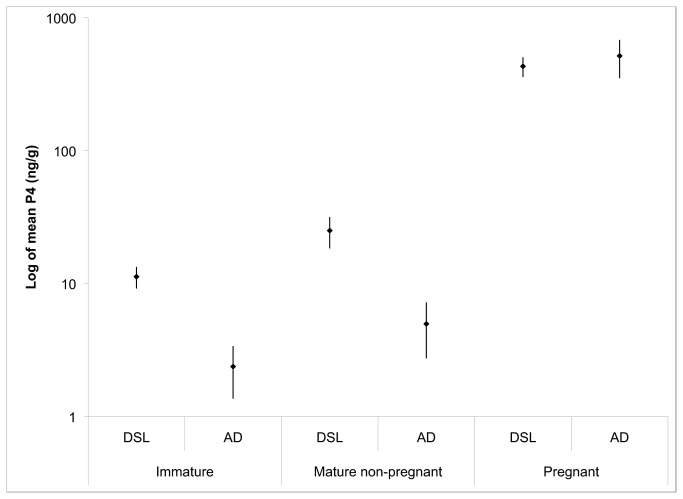
Figure 5. The mean P4 values obtained from Diagnostic Systems Laboratory (DSL) and Enzo Life Sciences/Assay Designs (AD) EIA kits according to reproductive class.
Note that the y-axis is presented on a log10 scale to show a wide range of P4 values; whiskers indicate the standard error of the non-log values.

