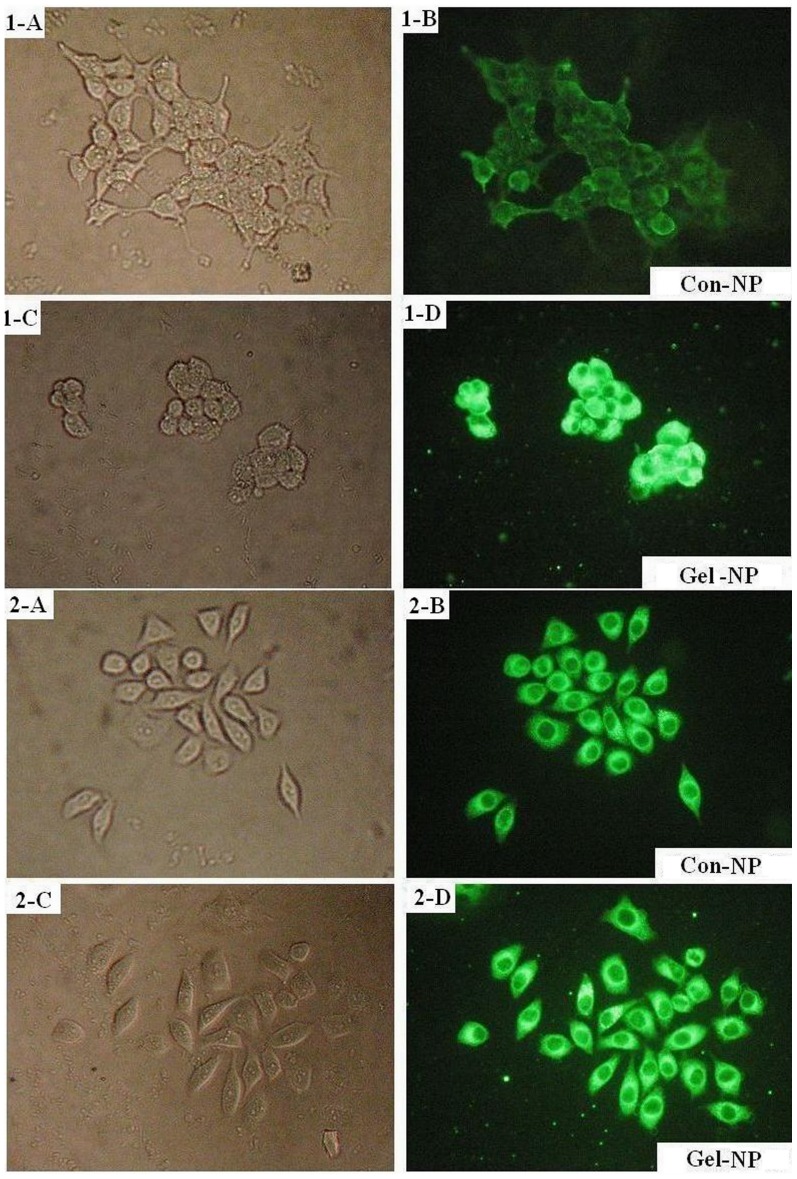
Figure 5. Fluorescence microscopic images of BGC-823 (gelatinase low expressing) and 293T (gelatinase-high expressing) cells after 8 hrs’ incubation with coumarin-6-loaded Con-NPs and Gel-NPs.
The uptake of coumarin-6-loaded NPs in cells was visualized by FITC filter (magnification = 200×). Fig. 5-1-A and 5-1-B: the optical microscopic and fluorescence microscopic images of BGC-823 cells incubated with coumarin-6 loaded Con-NPs for 8 hrs. Fig. 5-1-C and 5-1-D: the optical microscopic and fluorescence microscopic images of BGC-823 cells incubated with coumarin-6 loaded Gel-NPs for 8 hrs. Fig. 5-2-A and 5-2-B: the optical microscopic and fluorescence microscopic images of 293T cells incubated with coumarin-6 loaded Con-NPs for 8 hrs. Fig. 5-2-C and 5-2-D: the optical microscopic and fluorescence microscopic images of 293T cells incubated with coumarin-6 loaded Gel-NPs for 8 hrs.

