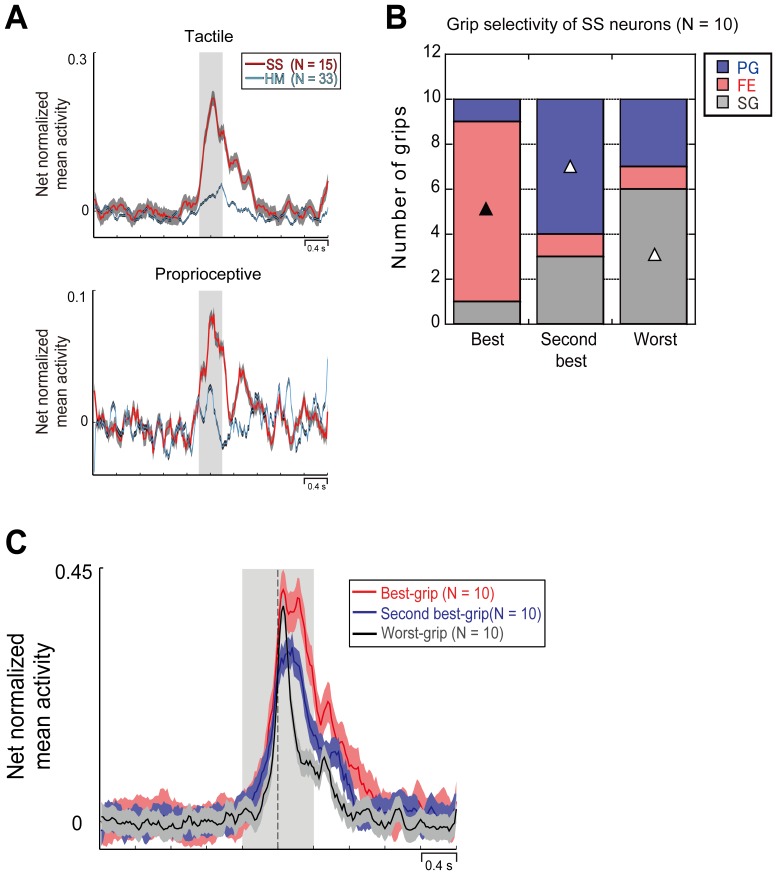
Figure 5. Grip-selectivity of SS-related neurons.
(A) Temporal profile of tactile and proprioceptive net normalized mean activity of the somatosensory (SS)-related and hand-manipulation (HM)-related populations. Gray-shaded regions indicate stimulation epoch (400 msec). Activity during the somatosensory stimulation was significantly stronger in SS-related population than hand-manipulation-related one (for each, p<.0001). (B) Proportion of each grip in the three grip categories (Best-, Second best- and Worst-grip). Conventions as in Figure 4. (C) Temporal profile of the net normalized mean activity of each grip categories. Conventions as in Figure3.

