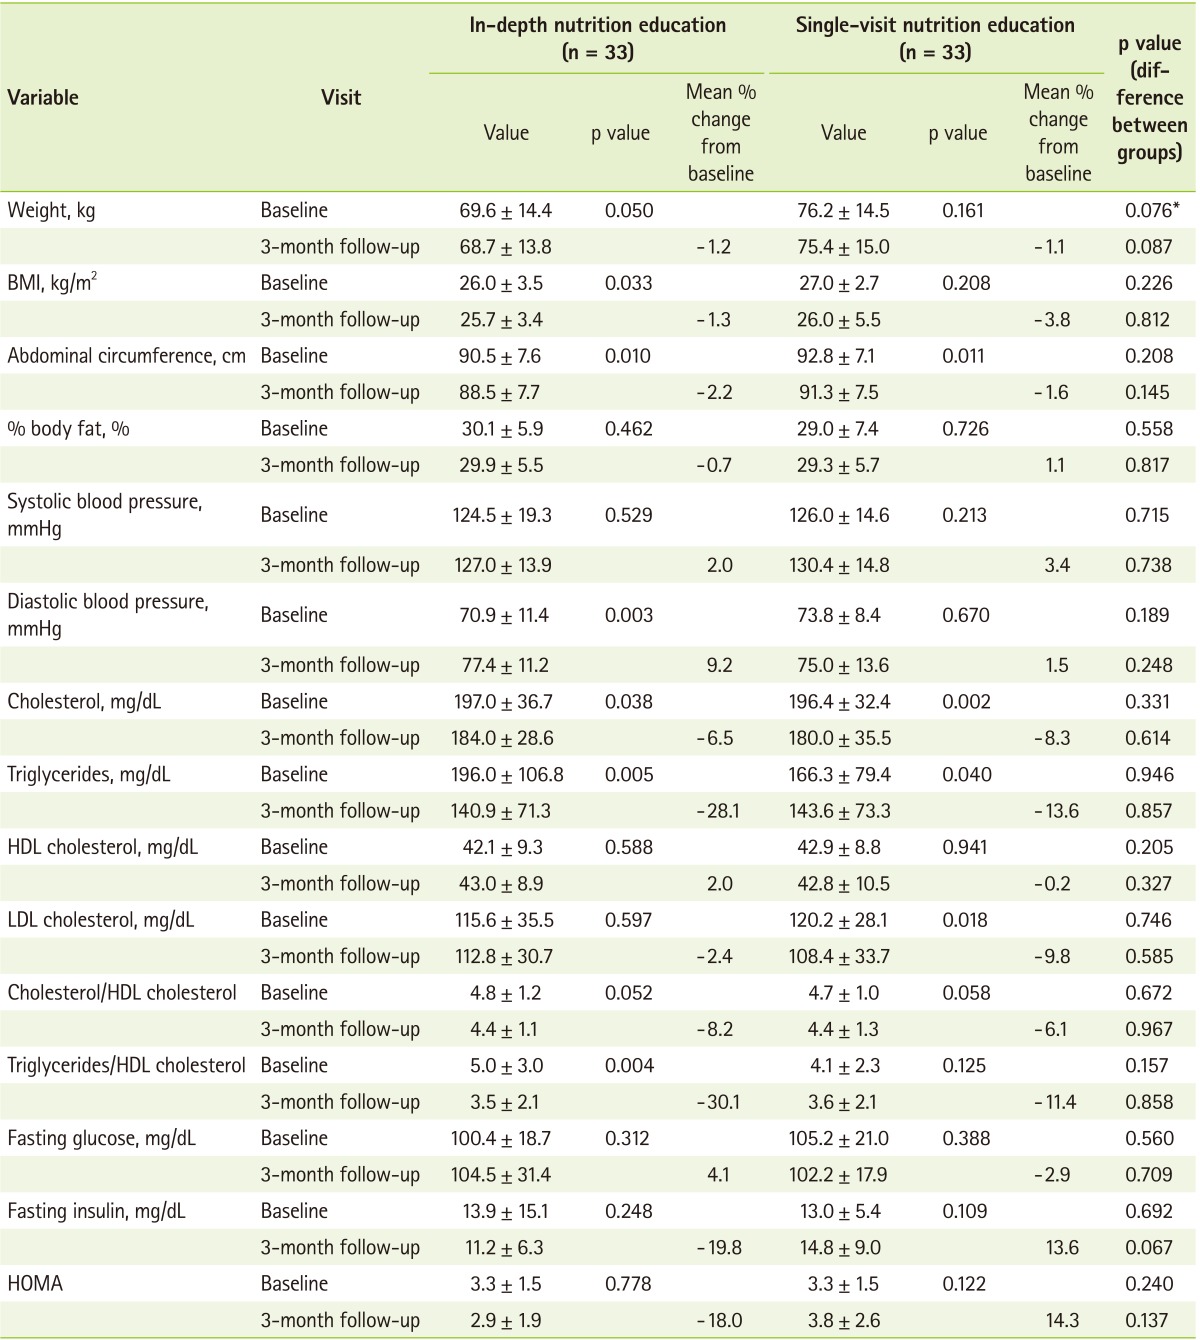
Table 3.
Changes in intervention diets on cardiovascular risk variables at baseline and 3-month follow-up of intervention

Values are presented as mean ± SD.
HOMA: homeostasis model assessment.
*Comparing the values between groups using unpaired t-test.
