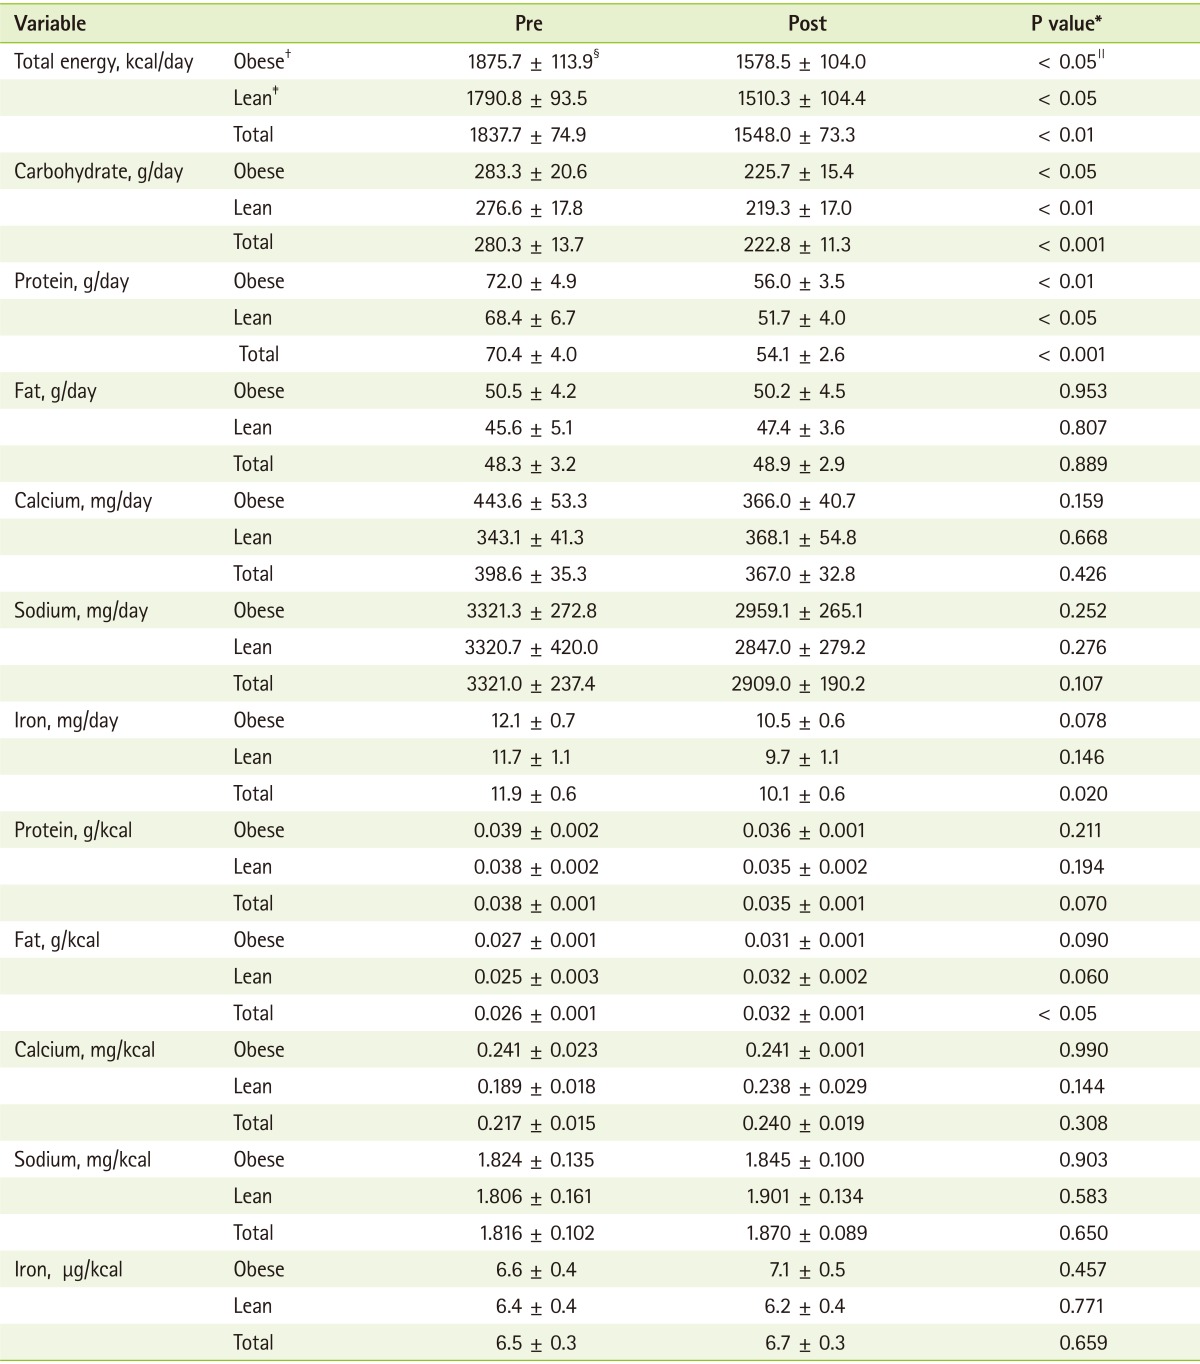
Table 3.
Changes of energy intake and food consumption of the subjects

*Significance as determined by paired t-test; †Obese: 23 ≤ BMI; ‡Lean: 18.5 ≤ BMI ≤ 22.9; §Mean ± standard error, ∥Significantly different between pre and post of the study.
Changes of energy intake and food consumption of the subjects

*Significance as determined by paired t-test; †Obese: 23 ≤ BMI; ‡Lean: 18.5 ≤ BMI ≤ 22.9; §Mean ± standard error, ∥Significantly different between pre and post of the study.