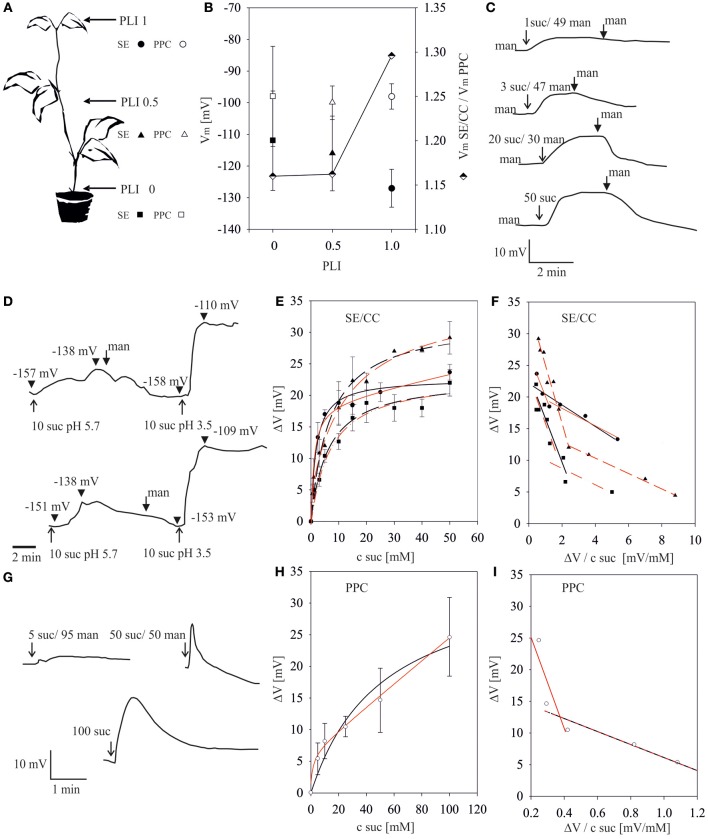
Figure 1.
Sucrose-induced depolarizations in sieve-elements (SEs) and phloem parenchyma cells (PPCs) along the stem of intact Vicia faba plants. (A) Plant length indices (PLIs: 1.0, mid-vein of the youngest mature leaf; 0.5, half-way the stem; 0, stem-to-root transition area) standardize the microelectrode positions along plants of diverse lengths. The symbols (circles, triangles, squares) associated with certain PLIs are used in the following figures. The numbers associated with sucrose (suc) and mannitol (man) in the following figures represent their concentrations (mM). (B) Membrane potential resting levels (Vm, ±SD, left y-axis) in SE/CCs and PPCs along the plant axis. Membrane potential ratios (VmSE/CC/VmPPC, semi-filled diamonds, right y-axis) along the phloem pathway. (C) Typical recorder traces showing the time-course of the change in SE membrane potentials at PLI 1.0 in response to the addition of 1, 3, 20 and 50 mM sucrose, respectively. The start of perfusion with test solutions is marked by arrows, that of mannitol rinsing by fat arrows. (D) pH-dependence of sucrose uptake into single SEs. Depolarizations in response to 10 mM sucrose pH 5.7 and 10 mM sucrose pH 3.5 intermitted by rinsing with mannitol. The start of perfusion with test solutions is marked by arrows, that of mannitol rinsing by fat arrows. Arrowheads mark the membrane voltage. (E) Relationship between sucrose-induced depolarizations (y-axis) of SEs and external sucrose concentrations at pH 5.7 (x-axis) at different PLIs (n = 5 to 10 for each concentration). Data points where fitted either to a single MM term (black line) or to the biphasic MM equation (red line) (F) Eadie–Hofstee transformation of sucrose-induced depolarization as a measure for sucrose uptake at different PLIs for SEs. In Eadie–Hofstee plots, the negative slopes of linear fits represent the -Km values. For linear regressions of the data from PLI 1 and PLI 0 either a single MM (black line) or a biphasic MM (red line) kinetic is assumed. For PLI 0.5 two components were unequivocally identified (G) Typical recorder traces showing the time-course of the change in PPC membrane potential at PLI 1.0 in response to 5, 50 and 100 mM sucrose, respectively. (H) Relationship between membrane potential depolarizations (ΔV, y-axis) and supplied sucrose concentrations (x-axis) of PPCs at PLI 1 at pH 5.7 (n = 10 for each concentration). Data points where fitted either to a single MM term (black line) or biphasic MM term (red line). (I) Eadie–Hofstee transformation of sucrose-induced depolarization of PPCs at PLI 1.

