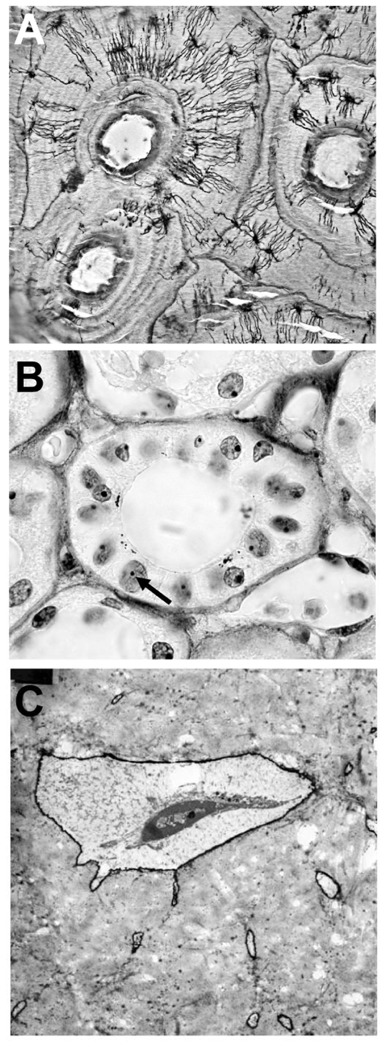
Figure 1.

AgNOR staining on human tissues. A) cortical bone: note the intense staining in the osteocyte canaliculi and lacunar walls. Staining is also evident on resting and arrest lines. Original magnification: ×100. B) renal cortex: a distal convoluted tubule is observed in cross section. Note the NORs in a tubular nucleus (arrow) and the granules at the apical side of the cells. Original magnification: ×400. C) TEM of a bone osteocyte and lacuna stained by the AgNOR method. The staining is restricted to the lacuna’s wall and the periphery of the canaliculi. Original magnification ×9,000.
