
Figure 5.
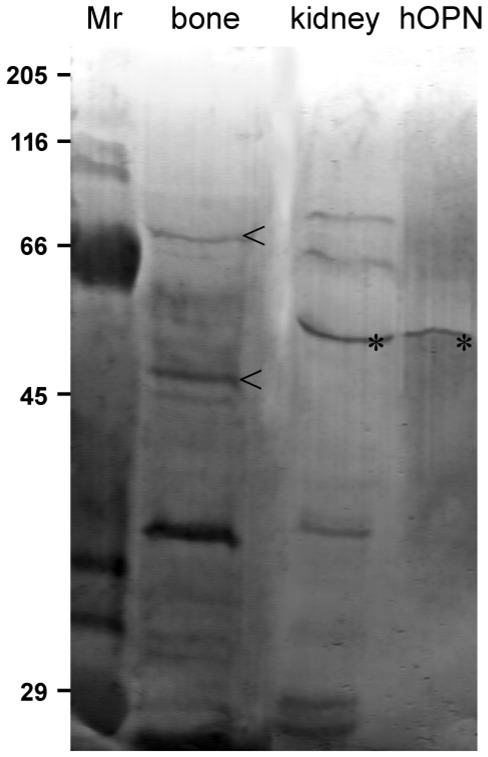
Analysis of protein extracts by 12% SDS-PAGE. AgNOR staining on membrane. The same amounts of proteins as in figure 4. Only a few specific bands of proteins are stained. Note the positive OPN bands at 56kDa for the purified hOPN that can be associated to a similar argyrophilic protein in human renal cortex (*). Bovine bone tissue exhibit AgNOR protein bands at 75 and 50kDa (<). Protein standards (Mr) indicate the position of the molecular weight markers.