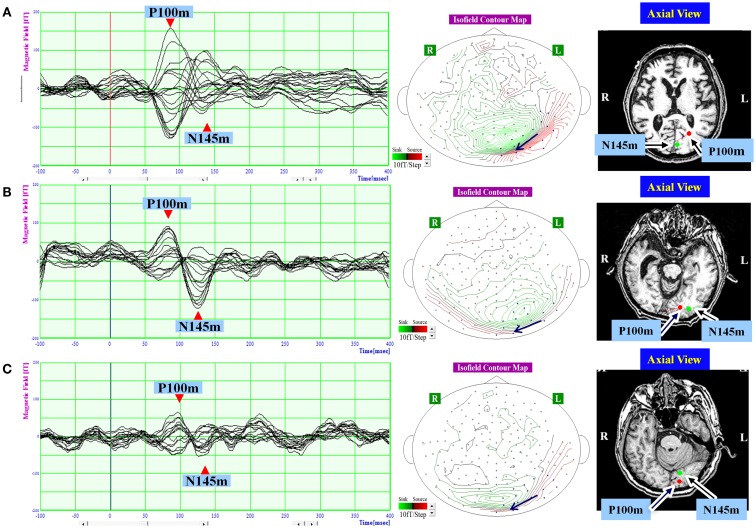
Figure 2.
The waveform and equivalent current dipole sources of visual evoked magnetic fields elicited by right hemifield stimulation in patients with unilateral spatial neglect. Left: the waveforms of visual evoked magnetic fields (VEFs) in response to pattern-reversal stimulation of the right hemifield in Patient 1 (A), Patient 2 (B), and Patient 3 (C). Waves detected by selected 16 magnetoencephalography recording channels are superimposed. Around 200 responses were averaged for each patient. Middle: the location of the 16 channels used to estimate ECD on the isofield contour map at peak time of P100m. In a contour map, green lines represent outward-going flux, and red lines represented inward-going flux. A black arrow indicates an expected location and direction of ECD. Small circles indicate distribution of recording sensors. Blue circles indicate selected 16 channels. Right: the equivalent current dipoles (ECDs) superimposed on axial magnetic resonance images. Red represents the P100m component of the VEF; Green represents the N145m component of the VEF. The dot represents dipole location, and the bar represents dipole direction. Both components were evident and were located in occipital lobe in all patients. The P100m component was directed medially, and the N145m component was directed laterally.

