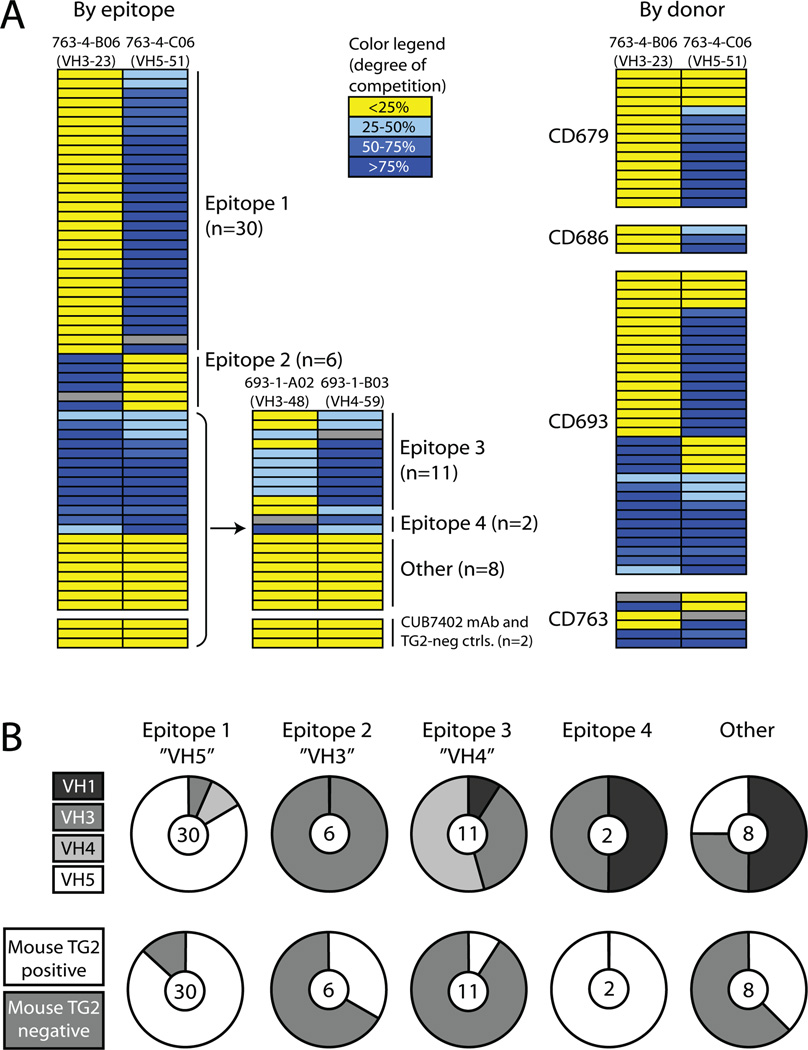
FIGURE 1.
Grouping of TG2-reactive mAbs according to epitope binding. (A) Assignment of antibody epitopes according to competition for TG2-binding by mAbs. Each row represents a mAb and the color code indicates the degree to which it inhibits TG2 binding of the mAb indicated at the top of each column. The mAb representing each column was biotinylated and TG2 binding in the presence of an excess of competing unlabeled mAb was determined in an ELISA binding assay. Gray fields indicate competition between labeled and unlabeled versions of the same mAb. The degree of inhibition by all other mAbs was calculated from the reduction in signal relative to the signal reduction that was measured when each reference mAb competed with itself. The TG2-reactive mouse mAb CUB7402 and two TG2-negative mAbs cloned from celiac disease patient small intestinal plasma cells were included as controls. The four biotinylated mAbs reported here were chosen on the basis of extensive preliminary competition experiments suggesting that they represent four different epitopes. In the right panel, the competition pattern of the mAbs is shown in relation to the four patients they were derived from. (B) The upper panel shows the number of mAbs in each epitope group and their distribution among different VH families. Epitope 1, 2 and 3 are mainly represented by VH5, VH3 and VH4 antibodies, respectively. The lower panel shows the reactivity of mAbs in each epitope group with mouse TG2 in ELISA. The mAbs were scored either as mouse TG2 positive or negative.

