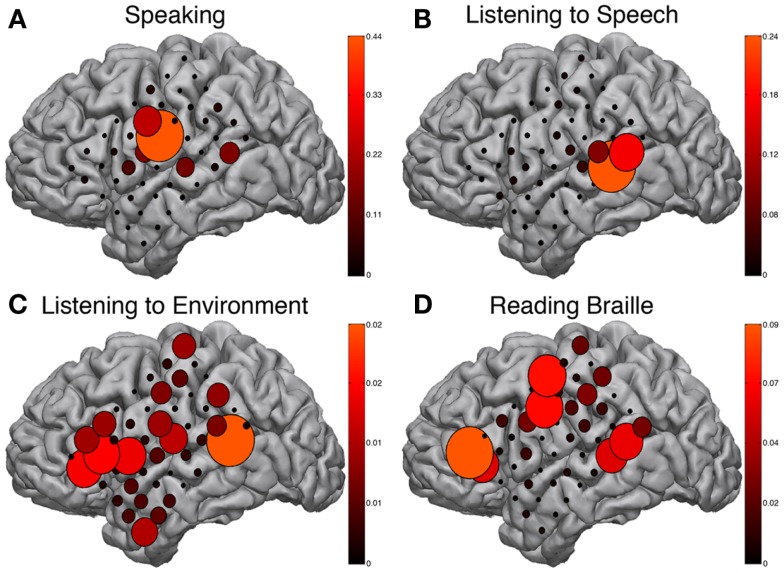
Figure 4.
SIGFRIED mapping. Results from SIGFRIED mapping of speaking (A), passive listening to speech (B), passive listening to environmental sounds (C), and continuously reading Braille (D). Size and color hue of circles are linearly related and represent correlation of signal changes with task performance from baseline signal profile recorded during rest. Each sub-figure scaled independently to max SIGFRIED score for respective task.

