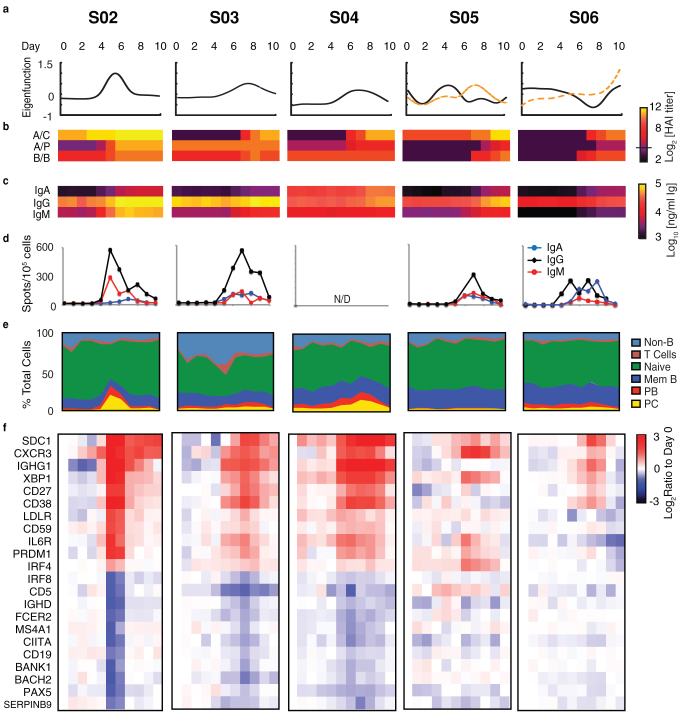
Figure 2. Subject-specific B cell vaccine response characteristics.
(a) A single gene expression eigenfunction accounted for 90% of sample variation in each subject vaccinated in the previous three years (S02, S04, and S04). Multiple eigenfunctions were found in RNA Seq data of subjects not previously vaccinated (S05, S06) (full list of significant genes in Supplementary Table S3). (b) By HAI titer, S02, S03 and S04 had previous immunity to two HA antigens. S02 had increases in antibody levels at least 24 hours before S03 and S04 (p-values, Supplementary Table S2). (c) Anti-vaccine IgM, IgG, and IgA levels parallel changes in HAI titer (p-values Supplementary Table S2). (d) ELISPOT assays show functional vaccine-specific IgA, IgG, and IgM ASC increase as serum antibody levels increase. (e) Phenotypic changes of CD3−CD19+CD20+CD27− naïve B cells, CD19+CD27+CD20+CD38+CD138− memory B cells, CD19+CD27++CD38++CD138− plasmablasts and CD19loCD20loCD27++CD38++CD138+ plasma cells. Plasmablast and plasma cell populations increase as ASC appear (p-values Supplementary Table S4). (f) Expression of genes (ratio to day 0) change as expected based on available literature in S02, S03 and, S04 (p-values, Table S3). CD5 and SERPINB9 levels decrease at peak response consistent with a fractional decrease in naïve and cytolytic B cells. Fewer genes changed significantly in S06 and S05, subjects reporting no vaccination in the previous 3 years. S02 showed peak response at day 5, earlier than S03 and S04. (N/D = no data).

