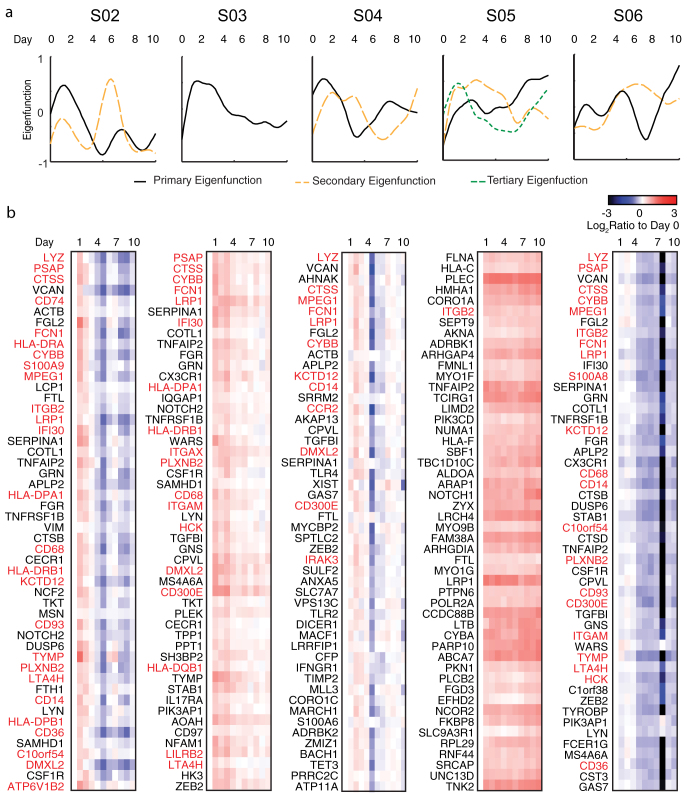
Figure 7. PBMC Gene Expression Patterns Suggest Myeloid/Dendritic Cell Migration.
PBMC were isolated in parallel with enriched B cell samples. (a) FPCA analysis of RNA Seq data showed a primary eigenfunction that explained over 70% of the variation across the timepoints for four subjects (S02, 81.44%) (S03, 86.68%) (S04, 72.8%) (S05, 57.15%) (S06, 85.32%). Second eigenfunctions explained most of the remaining variation in three subjects (S02, 13.11%) (S03, 7.24%) (S06, 10.2%). S05 had a third eigenfunction that explained 13.85% of variation. The first eigenfunction for S02, S03, and S04 peaked day 1. (b) The largest positive loadings on these functions were enriched for genes expressed by myeloid/DC lineages (gene symbols in red), (Supplementary Table S8). The first eigenfunction for S05 had few myeloid/DC genes. Second and third eigenfunctions, peaking day 1, both contained small numbers of myeloid/DC genes. The first eigenfunction of S06 peaking on day 1 was enriched for myeloid/DC genes, but expression changes were modest. Day 8 there was a sample processing error.

