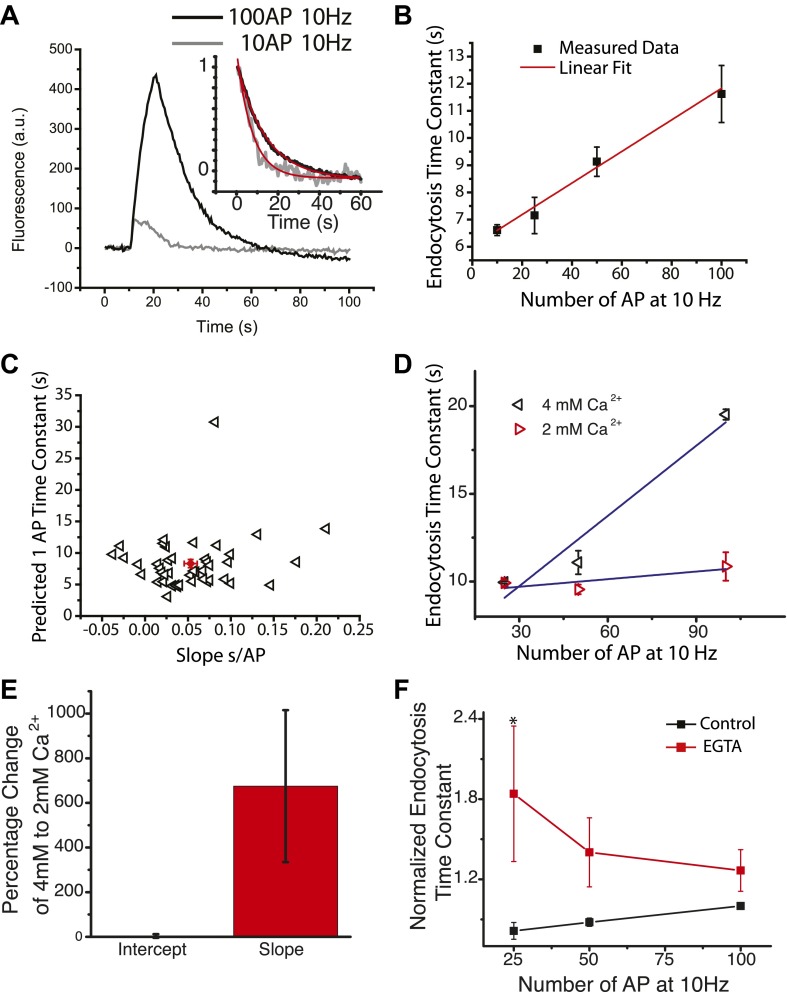
Figure 1. Calcium slows endocytosis at 30°C.
(A) Endocytosis decays from a 100 AP 10 Hz run (black) and 10 AP 10 Hz runs (2–3 runs averaged) (gray), inset shows endocytosis phase fit with a single exponential decay (red) to measure endocytosis time constant = 13.9 ± 0.10 s, 6.8 ± 0.3 s 47 boutons. adj. R-square of fits 0.95, 0.997 respectively. (B) An example cell probed multiple times at 10, 25, 50, 100 AP at 10 Hz at 30°C, fit with a linear dependence with a slope of 0.058 ± 0.004 s, a predicted 1 AP time constant of 6.09 ± 0.11 s. (C) Across 44 cells, the slope (s/AP) is plotted against the predicted 1 AP time constant (s). Average slope 0.053 ± 0.008 s, average predicted 1 AP time constant 8.31 ± 0.64 s. There is a CV of 100% in the slope and 52% in the predicted 1 AP time constant. (D) Endocytosis for 25, 50 and 100 AP delivered in 2 mM and 4 mM external Ca2+ for the same set of boutons from one cell. Each condition was probed 1–4 times and averaged over 46 ROIs. Slope of 2 mM is 0.01 ± 0.01 s/AP, 4 mM is 0.13 ± 0.03 s/AP. The intercept of 2 mM is 9.3 ± 0.7 s, 4 mM is 5.7 ± 2.0 s. (E) Across 10 cells the percentage change in slope and predicted 1 AP time constant when changing from 2 mM to 4 mM external Ca2+ slope and predicted 1 AP time constant. The change in slope is significantly different from 0, (log corrected one sample t-test p<0.004). (F) 25, 50, and 100 AP at 10 Hz endocytosis time constant compared before and after 90 s load of 100 μM EGTA-AM reveals an acceleration phase of endocytosis for low stimulus number (25 AP significantly different before and after EGTA treatment, paired sample t-test p<0.03, N = 6 cells).

