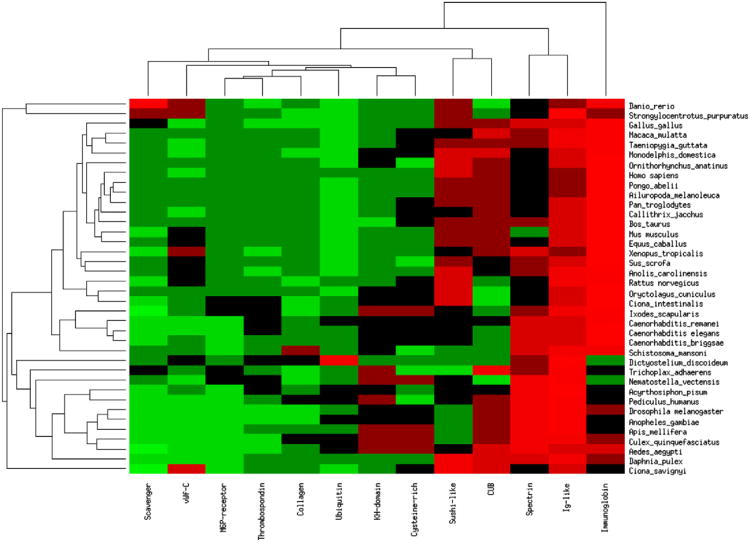
Fig. 1.
Long repeat domains in vertebrate species. Hierarchically clustered heatmap of the commonality of the long repeat domains (LRD) (x-axis) in the various species listed on the y-axis. Each cell in the heatmap reflects the fraction of the LRD among all LRDs in the species. The brighter the red, the more common the repeat is in the species while green indicates that the domain is less common. The frequencies are clustered by row and then by column using euclidian distance and average linkage.

