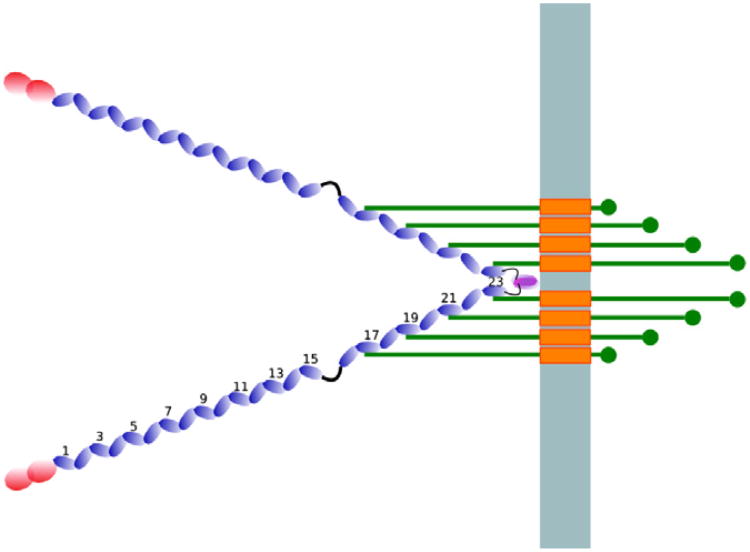
Fig. 3.
Schematic illustration of human filamin in the cell. The light blue bar represents the membrane, the blue beads illustrate the filamin domains and the red beads illustrate the actin-binding domain. The green bars represent β-integrins and the orange rectangles their transmembrane regions. The numbers show the positions of the filamin domains relative to the N-terminus. Note that the image is a schematic and may not reflect the mechanics of the filamin–integrin interaction.

