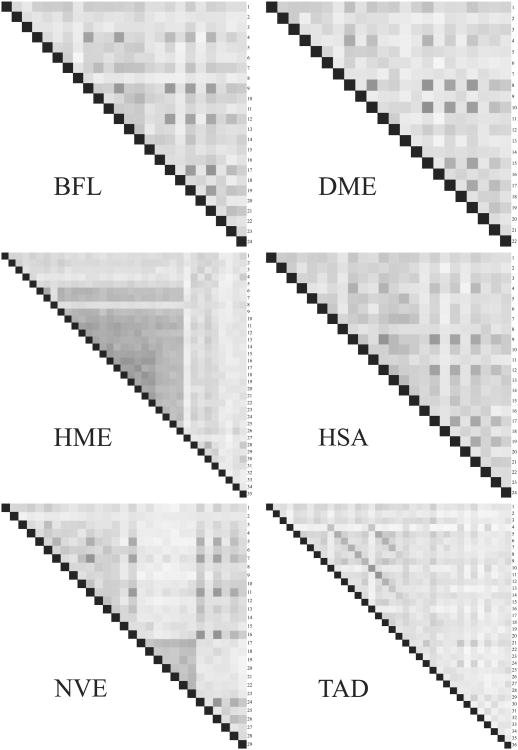
Fig. 5.
Internal similarity matrices for filamin proteins. Each cell represents a filamin domain. The darker the cell, the higher sequence similarity between the two domains compared in that cell. Opacity values can only be compared within one protein, since the values are normalized against the highest score for that particular protein. BFL – Branchistoma floridae, DME – Drosophila melanogaster, HME – Hirudo medicinalis, HSA – Homo sapiens, NVE – Nematostella vectensis and TAD – Trichoplax adhaerans.

