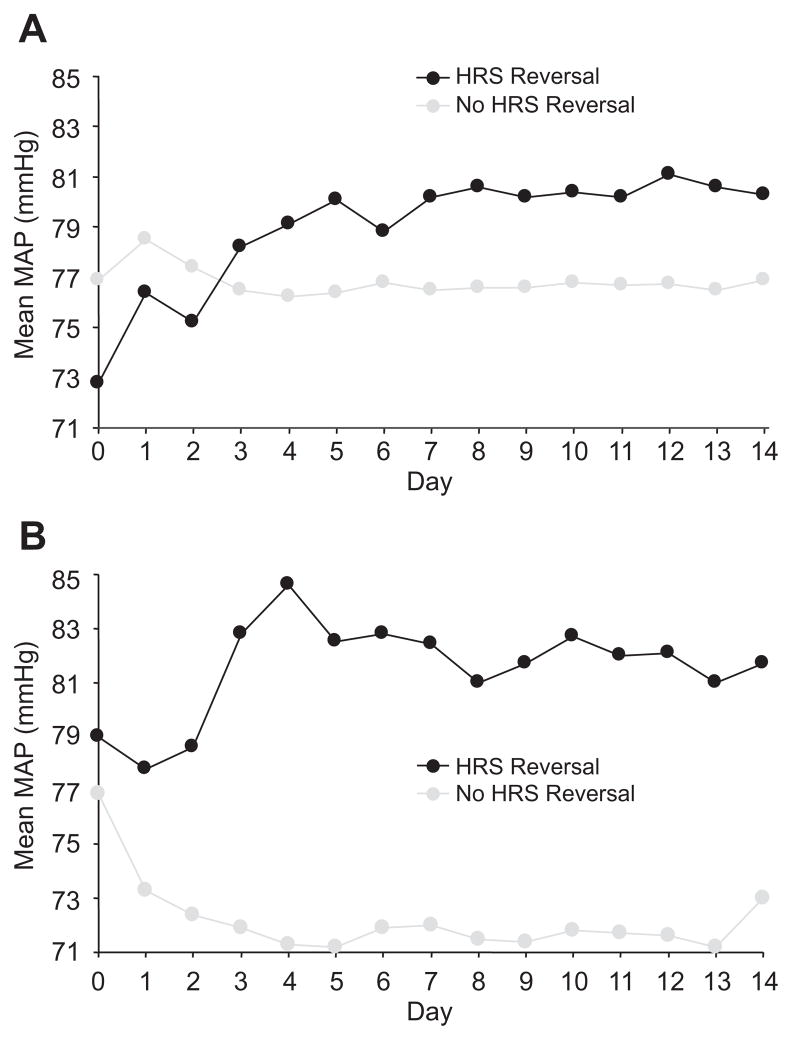
Fig. 1. Mean arterial pressure in patients treated with (A) terlipressin or (B) placebo.
Each data point represents the MAP averaged for 4 injections/day measured just before and 2 h after terlipressin/placebo, presented using last observation carried forward. (A) Mean MAP over time on terlipressin. (B) Mean MAP over time on placebo.

