
Figure 1.
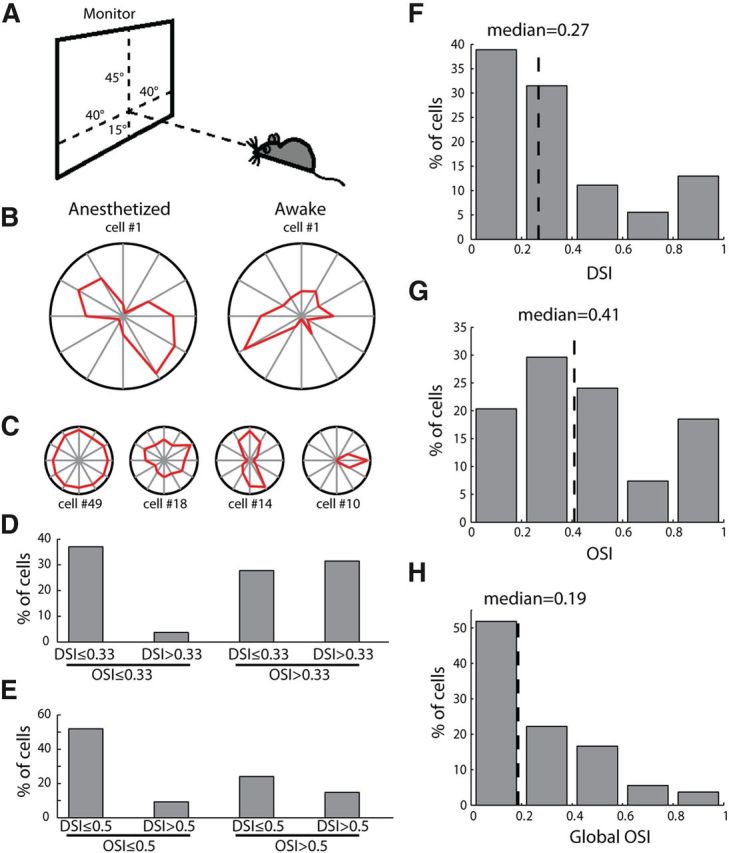
Direction- and orientation-selective responses in the mouse dLGN. A, Placement of visual stimulation. B, Polar plots of example orientation-selective responses in anesthetized and awake recordings. The radius was 6.1 spikes/s for the left panel and 6.7 spikes/s for the right panel. C, Example cells with diverse response properties. The four examples represented cells with different DSI and OSI values, and were aligned with the groups classified in D and E. The radius of each plot was 19.1, 11.7, 11.0, and 12.6 spikes/s, from left to right. D, Distribution of direction/orientation-selective cells, with a cutoff of 0.33 for DSI and OSI (n = 54). E, The same distribution with a cutoff of 0.5. F, Distribution of DSI (n = 54, median = 0.27). G, Distribution of OSI (n = 54, median = 0.41). H, Distribution of global OSI (n = 54, median = 0.19).