
Figure 10.
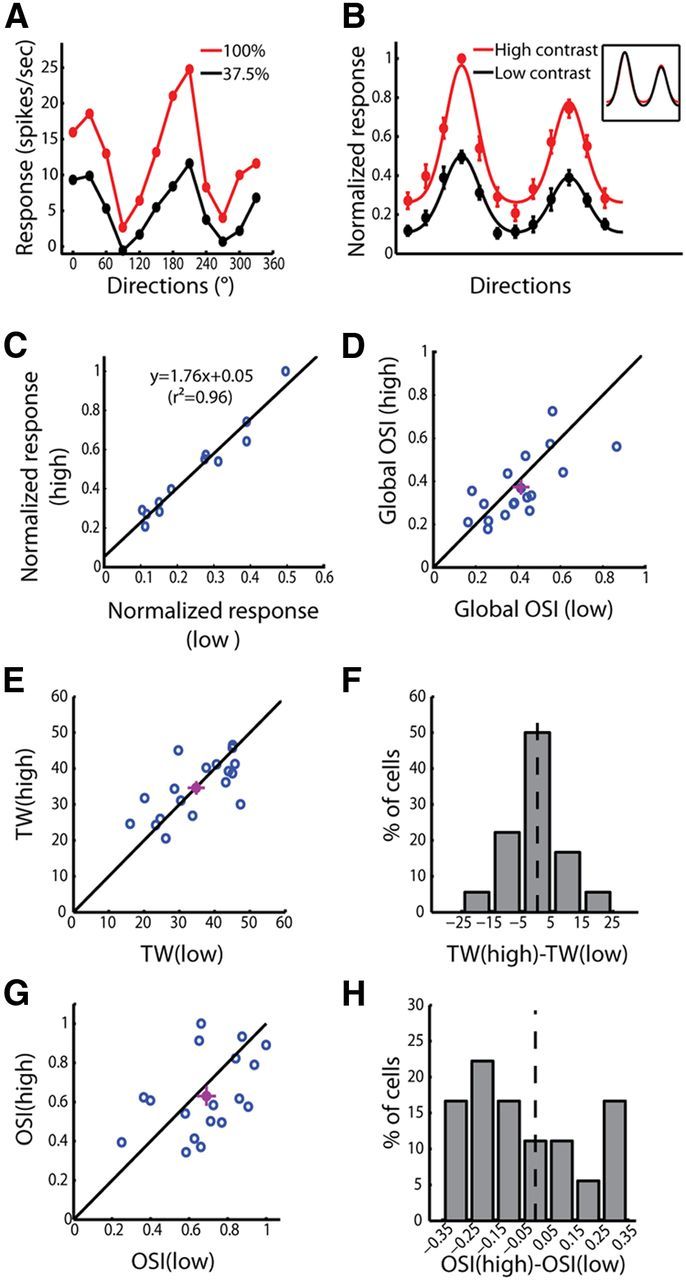
Contrast invariance of orientation selectivity in the mouse dLGN. A, Responses of an example cell at high (red) and low (black) contrasts. B, Normalized responses at high (red) and low (black) contrasts (n = 18). All responses were normalized by the peak response at the high contrast, and the preferred direction of each cell was aligned. Inset, Tuning curves at high and low contrasts were scaled to the same peak. C, Relationship between the normalized responses at high and low contrasts. The data were fitted with a linear function. D, Correlation between global OSI at high and low contrasts (p < 0.01). The mean ± SEM for each axis was plotted as the purple dot and bars. The unity line was plotted as well (black). E, Correlation between TWs at high and low contrasts (p < 0.001). F, Distribution of the differences between the TWs at high and low contrasts. The black dotted line marked 0. G, Weak correlation between the OSIs at high and low contrasts (p = 0.06). H, Distribution of the differences between OSIs at high and low contrasts. The black dotted line marked 0.