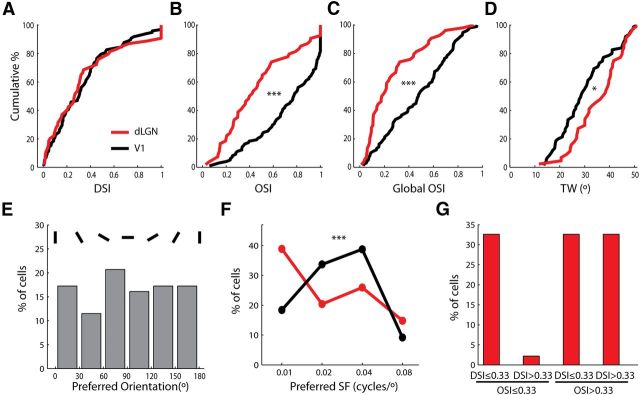
Figure 3.
Comparison of orientation tuning in dLGN and V1. A, Cumulative distributions of DSI in the dLGN (red) and V1 (black; n = 54 for dLGN and n = 98 for V1, p = 0.73, Kolmogorov–Smirnov test). B, C, Cumulative distributions of OSI and global OSI in the dLGN (red) and V1 (black; n = 54 for dLGN and n = 98 for V1, p < 0.001, Kolmogorov–Smirnov test). D, Cumulative distributions of TW of orientation-selective cells in the dLGN (red) and V1 (black; n = 44 for dLGN and n = 75 for V1, p < 0.05, Kolmogorov–Smirnov test). E, Distribution of the preferred orientations of selective cells in V1. F, Distributions of the preferred spatial frequency in the dLGN (red) and V1 (black). G, Distribution of direction/orientation-selective dLGN cells when analyzing responses at 0.02 or 0.04 cpd (whichever spatial frequency evoked a larger response, n = 46). Cells not responding to either spatial frequency were excluded.

