Figure 5.

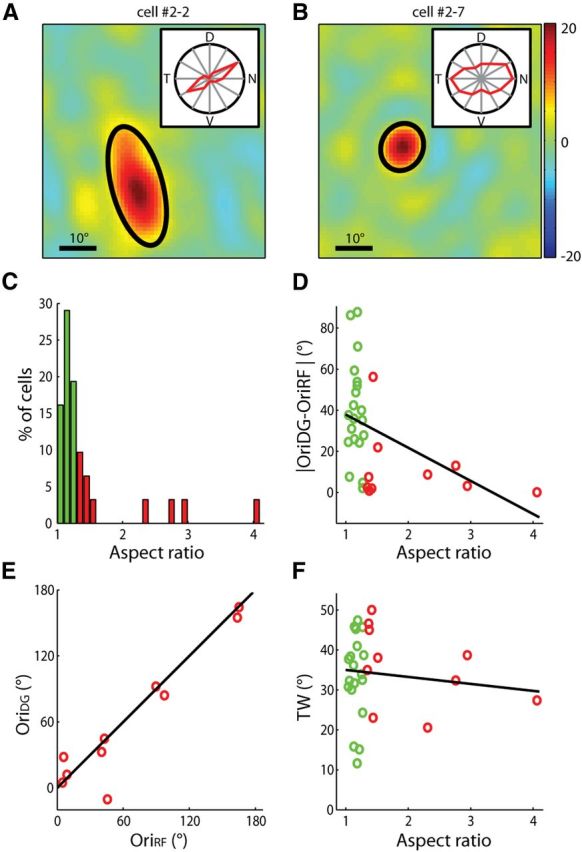
Receptive field structures of orientation-selective dLGN cells. A, B, Examples of elongated (A) and circular (B) RFs. Contours of fitted Gaussians at 2× SD were superimposed (black line). In both panels, the color scale ranged from −20 to 20 (the full range of visual stimulus was from −127 to 127). Inset, Polar plot of the cell's responses to drifting gratings. The radius of the polar plot represented 19.1 and 15.8 spikes/s, respectively. C, Distribution of aspect ratios of the RFs. Cells in the first three columns were classified as circular RFs (green), and the rest as elongated RFs (red; n = 30). D, The difference between the cell's preferred orientation and the orientation of the major axis of its RF decreased with the aspect ratio (n = 30, correlation coefficient = −0.43, p = 0.02). E, The RF orientation predicted the preferred orientation in the cells with elongated RFs. F, TW plotted as a function of the RF's aspect ratio (n = 30, correlation coefficient = −0.12, p = 0.55).
