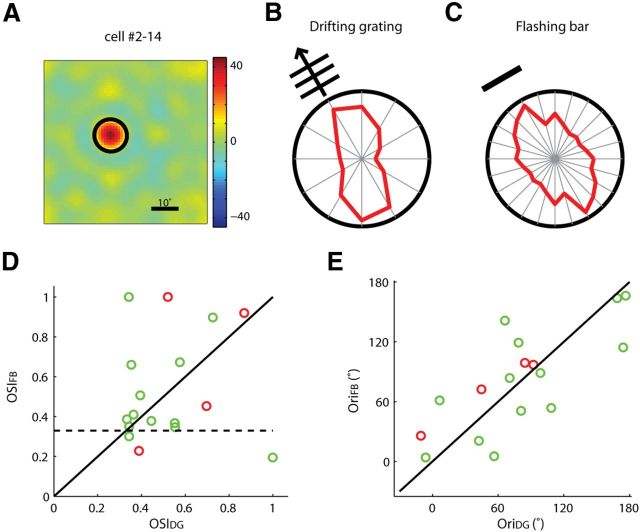
Figure 7.
Orientation-selective responses to flashed bars in mouse dLGN. A, An example dLGN cell with a circular RF. B, Polar plot of the example cell's responses to drifting gratings. The radius of the plot was 19.3 spikes/s. C, Polar plot of the same cell's response to flashed bars. The radius of the plot was 33.2 spikes/s. Note that each value was represented twice on this plot as the orientation was varied in the range of 0–180°. D, Scatter plot of OSIDG and OSIFB (n = 17). Cells with circular RFs are in green, and cells with elongated RFs are in red. The unity line (solid black) and the cutoff value for the selective group (dashed black) were marked. E, Scatter plot of the preferred orientations in response to drifting gratings and flashing bars (n = 17, correlation coefficient = 0.76, p < 0.01).

