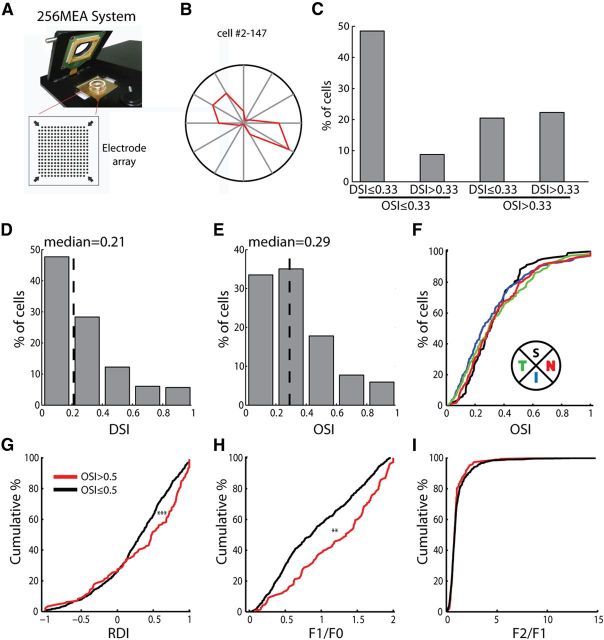
Figure 8.
Orientation/axis-selective RGCs in the mouse retina. A, Retinal recordings using a multielectrode array. B, Tuning curve of an example orientation/axis-selective RGC. The radius of the polar plot was 6.6 spikes/s. C, Distribution of direction/orientation-selective cells (n = 776, from 2 retinas). D, Distribution of DSI (n = 776, median = 0.21). E, Distribution of OSI (n = 776, median = 0.29). F, Cumulative distributions of OSI of cells in the superior (black, n = 103), inferior (blue, n = 236), temporal (green, n = 257), and nasal (red, n = 180) quadrants. p > 0.05 for comparing every pair, Kolmogorov–Smirnov test. G, Cumulative distribution of RDI, in response to full-field flash, of highly selective (red) and other cells (black; n = 146 for the selective group and n = 628 for the nonselective group, p < 0.001, Kolmogorov–Smirnov test). H, Cumulative distribution of F1/F0 in response to drifting gratings (median = 1.34 for highly selective cells and 0.86 for nonselective cells, p < 0.01, Kolmogorov–Smirnov test). I, Cumulative distribution F2/F1 (median = 0.75 for highly selective cells and 0.78 for nonselective cells, p = 0.17, Kolmogorov–Smirnov test).

