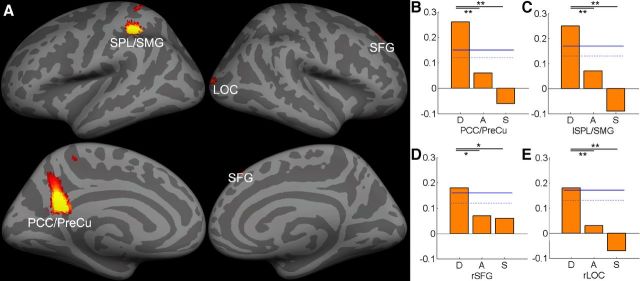
Figure 1.
A, MVPA revealed significant correlations between GMV and phonological decoding. The multivariate SVR decoding accuracy was mapped onto the inflated gray matter surface using FreeSurfer (http://surfer.nmr.mgh.harvard.edu/). The bar graphs show the prediction accuracy in B, PCC/PreCu, (C) left SPL/SMG, (D) right SFG, and (E) right LOC. The dotted and solid blue lines represent the 95th and 99th percentile of the distribution of the permutation results, respectively (*p < 0.05; **p < 0.01). D, Phonological decoding: A, form-sound association; S, naming speed. See Table 4 for ROI abbreviations.

