
Figure 2.
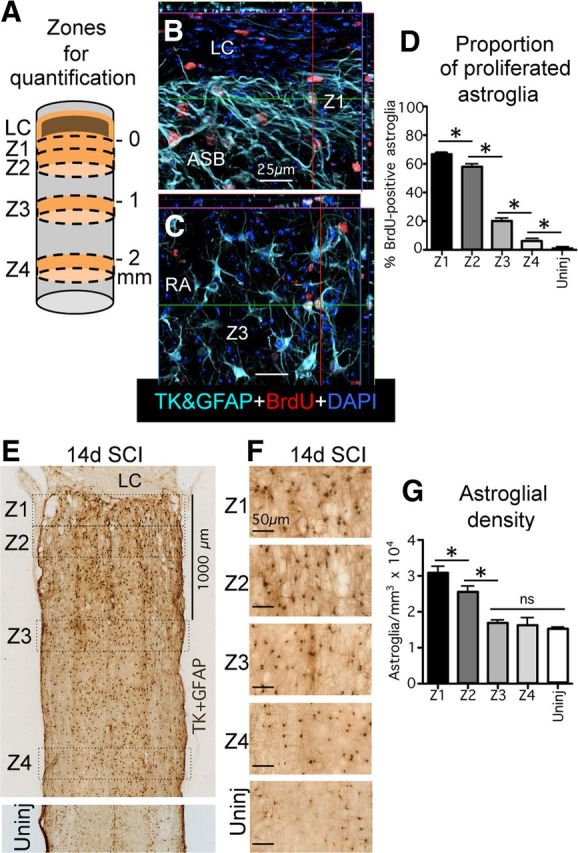
Mature scar borders consist of newly proliferated astroglia and have a higher density of astroglia than healthy tissue. A, Schematic drawing of spinal cord after SCI depicting the central core lesion with lesion core (LC) and four zones (Z1–Z4) of 250 μm width used for various quantitative morphometric evaluations. The border where the astroglia scar abuts the LC was taken as zero and Z1 was measured from this point. Z2 was started immediately adjacent to Z1. Z3 and Z4 were started at 1 and 2 mm, respectively, from zero. B, C, Multicolor fluorescence immunostaining for TK + GFAP and BrdU in Z1 (B) and in Z3 (C) at 14 d after SCI. Note the high proportion of BrdU labeling of elongated astroglia in the astroglial scar border (ASB) in Z1 (B) and that far fewer reactive astroglia (RA) are BrdU labeled in Z3 (C). D, Graph showing the proportion of BrdU-labeled, newly proliferated astroglia in Z1–Z4 after SCI and in uninjured tissue. E, F, Bright-field immunostaining of GFAP + TK showing survey (E) and details (F) of scar forming and RA cell bodies in Z1–Z4 after SCI and in uninjured tissue. G, Graph showing the density of astroglial cell bodies in Z1–Z4 after SCI and in uninjured tissue. n = 4 per group. *p < 0.05 (ANOVA with post hoc pairwise Bonferroni comparison). Scale bars: B, C, 25 μm; E, 1000 μm; F, 50 μm.