
Figure 4.
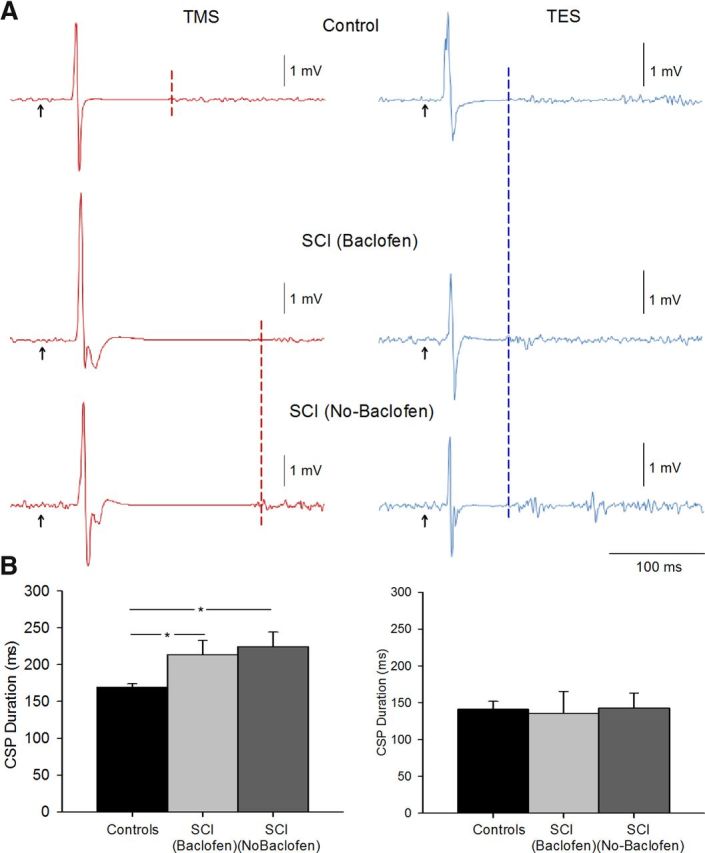
CSP. A, Raw MEP traces in representative subjects showing the CSP duration (indicated by dashed lines) after the MEP during 25% of MVC [control, top traces; SCI (Baclofen), middle traces; SCI (No-Baclofen), bottom traces] baclofen. Traces show the average 20 MEPs tested by TMS and 10 MEPs tested by TES. B, Group data tested by TMS [controls, n = 18, black bar; SCI (Baclofen), n = 8, light gray bar; SCI (No-Baclofen), n = 8, dark gray bar], and TES [controls, n = 10, black bar; SCI (Baclofen), n = 3, light gray bar; SCI (No-Baclofen), n = 3, dark gray bar]. The abscissa shows all groups tested and the ordinate shows the duration of the CSP. The duration of the CSP elicited by TMS was longer in patients compared with controls. Note that the duration of the CSP elicited by TES during voluntary contraction was similar across groups. Error bars indicate SEs; *p < 0.05.