
Figure 5.
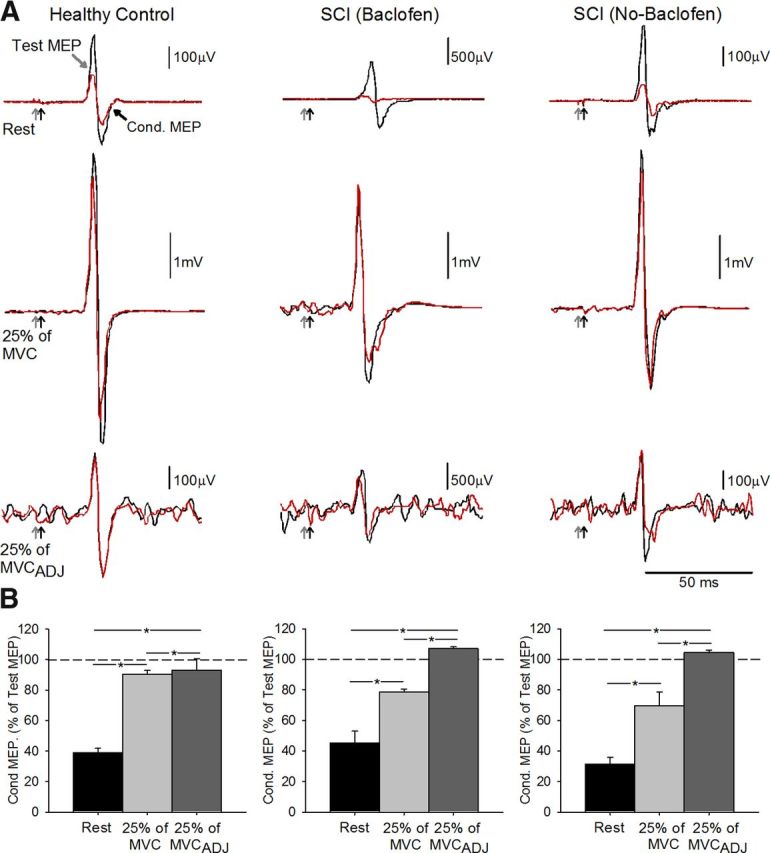
SICI. A, SICI recorded from the resting FDI in a representative control subject (top left traces) and in a patient taking (top middle traces) and not taking (top right traces) baclofen. The test MEP (black traces) and conditioned MEP (red traces) are indicated by black arrows. Traces show the average 20 test MEP and 20 Cond. MEP. B, Group data [controls, n = 10, bottom left; SCI Baclofen, n = 6, bottom left; SCI No-Baclofen, n = 6, bottom right]. The abscissa shows all conditions tested (rest, black bars; 25% of MVC, light gray bars; 25% of MVCADJ, dark gray bars). The ordinate shows the magnitude of the conditioned MEP expressed as a percentage of the test MEP. The horizontal dashed line represents the size of the test MEP. Note that SICI decreased during index finger abduction compared with rest in all groups tested. Error bars indicate SEs; *p < 0.05.