
Figure 6.
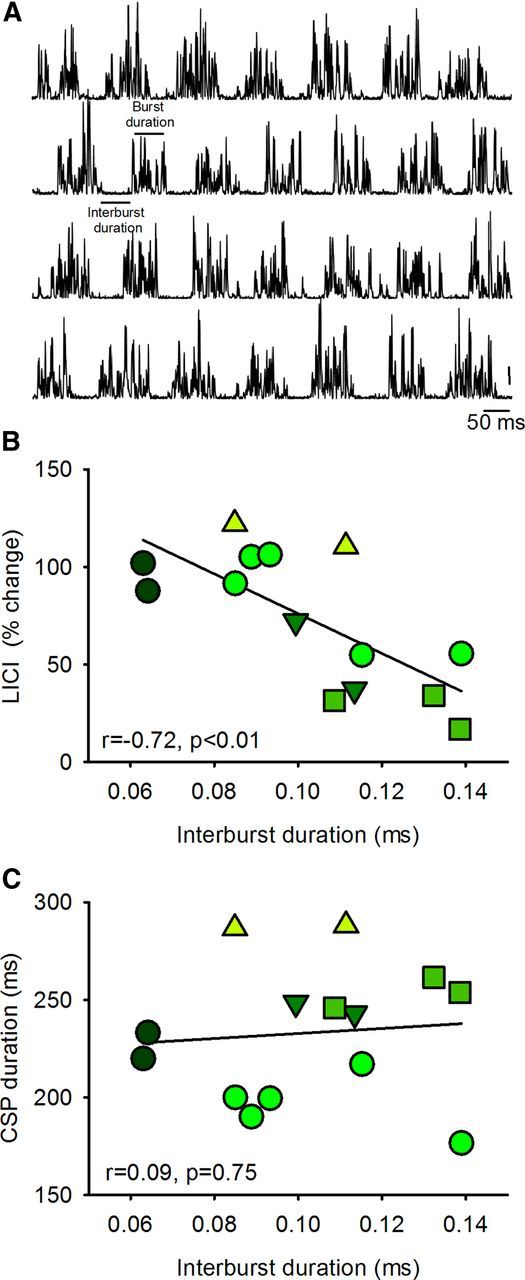
Clonus during voluntary contraction. A, Raw EMG traces recorded from the FDI muscle in a patient not taking baclofen during 25% of MVC. Traces show the rectified EMG in representative trials. Graphs show a correlation analysis between the average duration of periods of decreased EMG activity between bursts of clonus (interburst duration) and the magnitude of LICI (B), and CSP duration (C). In all graphs, the abscissa shows the duration of periods of decreased EMG activity between burst of clonus during 25% of MVC. The ordinate shows the magnitude of LICI (percentage change from rest to active) (B) and the CSP duration (C). Each symbol represents a different patient and repetition a symbol indicates multiple measurements in the same patient. Note that there was an inverse correlation between interburst duration and LICI but not the CSP. Thus, patients who showed more pronounced LICI during voluntary contraction also showed more prolonged periods of EMG silence during clonus in the FDI muscle.