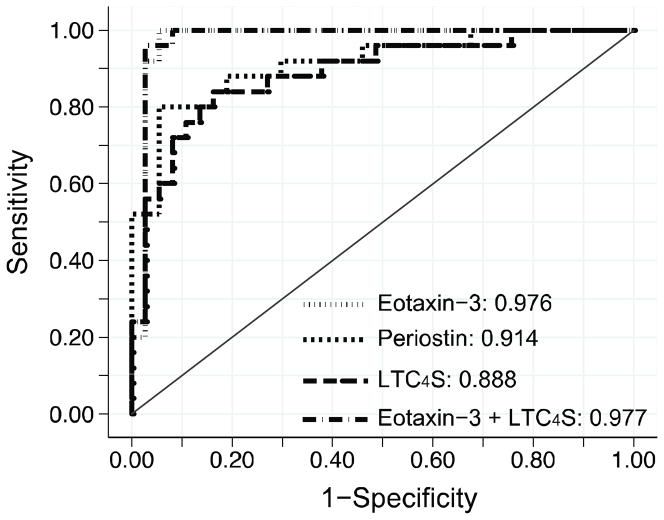
Figure 2. Sensitivity and specificity of elevated LTC4S mRNA levels in distinguishing EoE from non-EoE patients.
Receiver operator characteristic (ROC) curves were derived from a logistic regression model in which the proximal and distal oesophageal mRNA expression served as individual predictors. Area under the ROC curve was higher for eotaxin-3 than periostin (p=0.09) and LTC4S (p=0.03). Addition of LTC4S mRNA counts to a model that already included eotaxin-3 did not significantly increase the area under the ROC curve (p=0.75).

