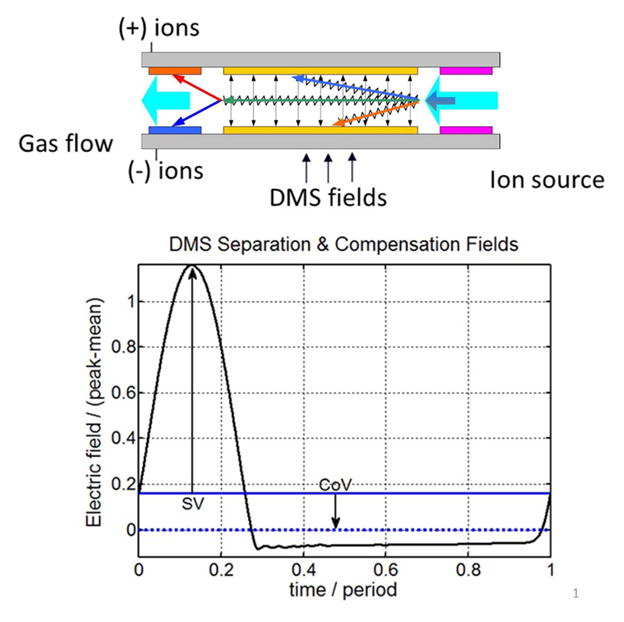
Figure 1.

Schematic of the DMS analytical region and notation for the waveform used in these experiments. The DMS ion filter is a simple planar region (typ. 0.5 mm gap, 10. mm length, 3 mm width, 300–600 ccm flow) with Faraday plate ion detection. The field applied across the channel is of the “flyback” type, with a period of 800 nsec. The solid horizontal line is the waveform time-average. DMS separation field (SV) is measured as waveform mean to peak voltage (SV), and compensation field (CoV) is measured as mean voltage difference.
